Evidence for a contribution of the community response to HIV decline in eastern Zimbabwe?
S. GregsonDepartment of Infectious Disease Epidemiology, Imperial College London, London, UK;Biomedical Research and Training Institute, Harare, ZimbabweCorrespondence[email protected]
,
C. NyamukapaDepartment of Infectious Disease Epidemiology, Imperial College London, London, UK;Biomedical Research and Training Institute, Harare, Zimbabwe
,
C. SchumacherDepartment of Infectious Disease Epidemiology, Imperial College London, London, UK
,
S. Magutshwa-ZithaBiomedical Research and Training Institute, Harare, Zimbabwe
,
M. SkovdalDepartment of Health Promotion and Development, University of Bergen, Bergen, Norway;London School of Economics and Political Science, London, UK
,
R. YekeyeZimbabwe National AIDS Council, Harare, Zimbabwe
,
L. SherrResearch Department of Infection & Population Health, University College London, London, UK
&
C. CampbellLondon School of Economics and Political Science, London, UK
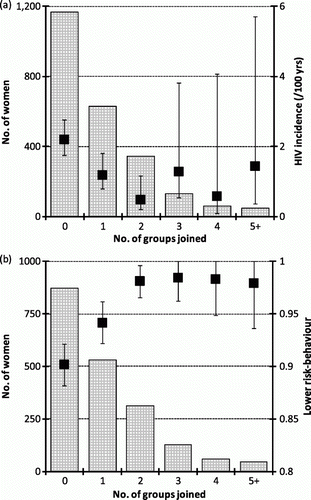
Figure 1. Dose effects of multiple community group membership on (a) HIV incidence and (b) reducing or maintaining low-risk behaviour, for women, 1998–2003. The scale bars in the histogram show the numbers of women by number of groups joined for each outcome. The square boxes with whiskers show the estimates and 95% confidence intervals, respectively, for HIV incidence (graph (a)) and adoption of lower risk-behaviour (graph (b)).
Table 1. Comparison of effects of community group membershipFootnotea: 2003–2008 versus 1998–2003.
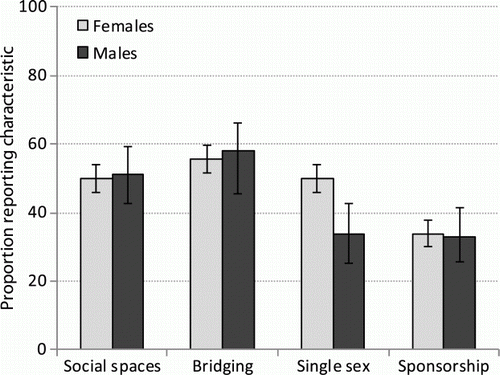
Figure 2. Frequencies of different group characteristics reported by members of community groups, 2003–2005. Note: Social spaces – group discusses HIV prevention; bridging – group assists or meets other groups; single sex – single sex versus mixed sex group; sponsorship – funding from an external source (e.g., NGO, employer or a government source).
Table 2. Characteristics of community groups associated with HIV risk, 2003–2008.