Sampson AntwiDepartment of Child Health, Komfo Anokye Teaching Hospital, School of Medical Sciences, Kwame Nkrumah University of Science and Technology, Kumasi, GhanaView further author information
Kofi Aikins AmisahDepartment of Child Health, Komfo Anokye Teaching Hospital, School of Medical Sciences, Kwame Nkrumah University of Science and Technology, Kumasi, GhanaView further author information
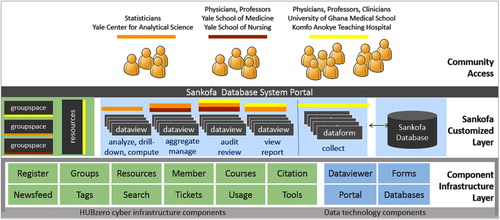
Figure 1. Sankofa database management structure. The infrastructure layer shows the components of HUBzero and the data technology that support the Sankofa Project. In the customized layer are the forms, views, groups, and database created using the components. This diagram illustrates the global nature of the interactions between clinical and research group, with the role-based access and sharing of de-identified patient data through a web-based portal to a centralized research database established on the collaborative HUBzero cyber infrastructure.
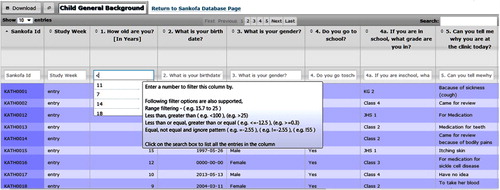
Figure 2. Dataview of baseline data at enrollment. Basic dataviews present raw data from a form. Data are controlled so that sites in Ghana can see only their own patients, statisticians can see all patients, and researchers from Yale cannot access the view. Columns can be sorted and dataviews are searchable on all columns using numeric or text-based features. Exported data are based on the filtered display.
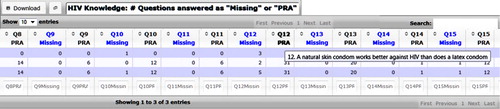
Figure 3. Audit dataview for missing and pra questions. Aggregate data for specific answers to questions are shown in this dataview. Note that Missing and PRA have specific meanings (different from “blank” fields), and this view is used to understand how patients are responding to the questions, so that decisions can be made about the effectiveness of the question formulation and questionnaire format.
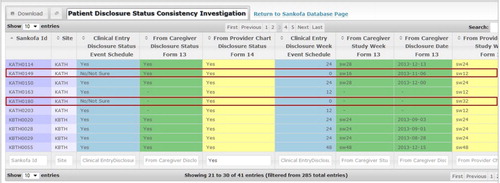
Figure 4. Consistency of HIV disclosure status. Audit dataviews were created to ensure consistency and accuracy of the primary outcome data. In this view, the HIV disclosure date identified by the clinician can be checked against values provides by different sources on different forms, with status, source, and date color-coded for easy checking. This view indicates that the clinician (blue) should update the site data according to health-care provided information (yellow). Caregiver (green) and Provider data are allowed to differ.
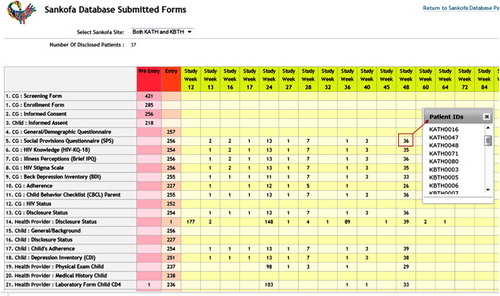
Figure 5. The events scheduler. Tracks the flow of submitted forms across the study week timeline. It guides clinical teams in data entry workflow, aggregates form totals by patient for data completeness, and provides drill-down to audit which forms and patients are missing data. This supports the collection of forms on a longitudinal basis according to patient and site requirements – the forms correspondence with events is not fixed a priori. In this audit view, tracking for forms and study weeks show aggregated form submit totals across the study, with click-on drill-down to patient IDs. A site-specific tracker checks by selected patient, with drill-down to the forms to edit.