Figures & data
Figure 1. Rates of domestic and community violence and harsh psychological discipline as a function of child HIV burden. Chi-square difference test was performed for all three types of violence *p < .05, **p < .01.
Table 1. Associations between exposure to violence and child functioning and mental health.
Table 2. Associations between exposure to violence and risk behaviour among 10–13-year olds (n = 469).
Table 3. Linear regression models showing predictors of child outcomes.
Table 4. Logistic regression model showing predictors of risk behaviour
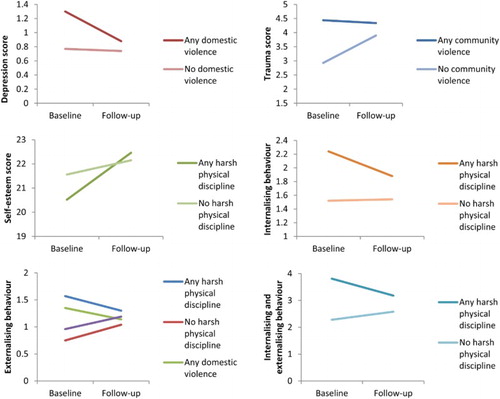
Figure 2. Change of child mental health measures over time according to exposure to domestic and community violence and harsh physical discipline. All differences between exposure and non-exposure to these three types of violence are significant (p < .05).