Figures & data
Table 1. Descriptive characteristics of study participants in SEARCH intervention communities.
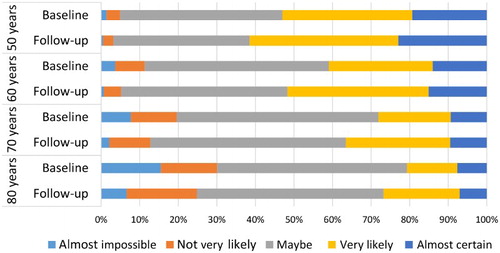
Figure 1. Trends in survival at baseline and follow-up year 1. Notes: Each bar represents participants’ subjective expectations to survive to age 50, 60, 70, and 80 using a 5-point Likert scale. Responses are presented separately for baseline and follow-up year 1. Expectations about survival to each of the target ages of 50, 60, 70, and 80 years were elicited from participants aged below the corresponding target age.