
Figures & data
Figure 1. Participant study diagram of HIV-positive men who were enrolled in the Anza Mapema study and examined in this analysis. M6 month 6; M12 month 12.
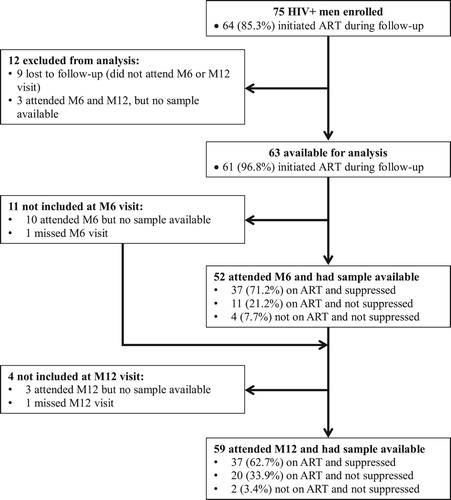
Figure 1. Participant study diagram of HIV-positive men who were enrolled in the Anza Mapema study and examined in this analysis. M6 month 6; M12 month 12.