Figures & data
Table 1. Characteristics of the study population in the intervention and comparison regions (N = 617).
Table 2. HIV vulnerability and related characteristics of participants in the intervention and comparison regions (N = 617).
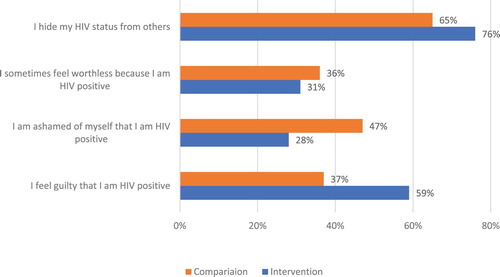
Figure 1. Self-stigma (N = 97; those who have known their HIV-positive status for at least a month).