
Figures & data
Figure 1. Flow chart showing baseline and follow-up in the two survey years 2017–2018 for cohort of AGYW.
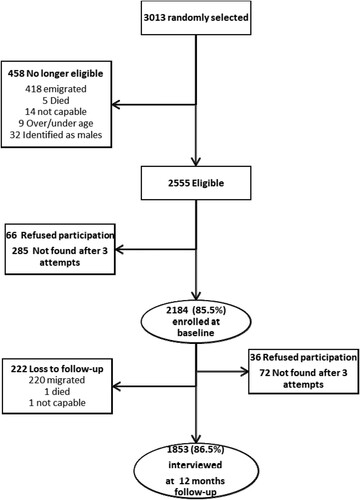
Table 1. Characteristics of AGYW at baseline in 2017 (N = 2184) and 12-months follow-up (N = 1853).
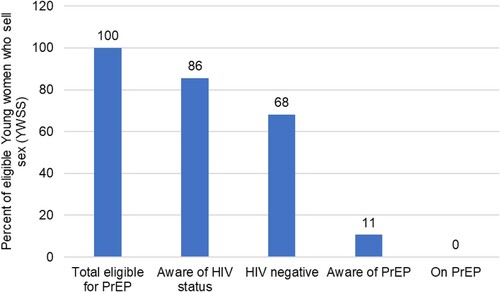
Figure 2. PrEP utilisation cascade among eligible AGYW involved in transactional sex/sex work in 2017–2018 (n = 194).
Data availability statement
The data that support the findings of this study are available from corresponding author [MS] upon reasonable request.