
Figures & data
Figure 1. Flow chart of study population from the InfCareHIV registry 2011–2016.
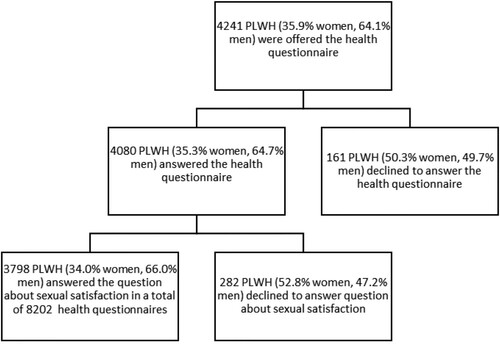
Table 1. Characteristics of the study population and the distribution of answers regarding self-reported sexual satisfaction at first visit.
Table 2. Univariable analysis of estimated levels of self-reported sexual satisfaction.
Table 3. Univariable analysis of relative risks (RR) of sexual satisfaction.
Figure 2. Self-reported sexual satisfaction in study group (all), women and men by age at visit.
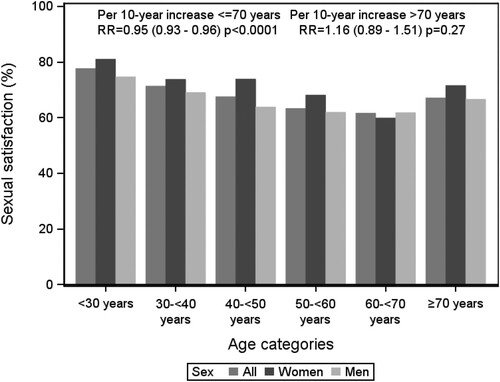
Figure 3. Self-reported sexual satisfaction in study group (all), women and men over time in calendar years.
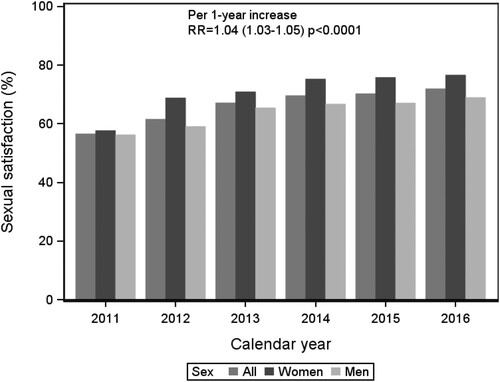
Table 4. Multivariable analysis of associations between sexual satisfaction and selected variables for all patients.
Supplemental material