Figures & data
Table 1. Adjusted prevalence ratios and corresponding confidence intervals for factors associated with a report of drug use among people living with HIV in Russia, 2019 (N = 150).
Figure 1. Adjusted prevalence ratios for the relationship between self-reported substance use disorder and self-reported diagnosis of various medical conditions among people living with HIV in the Russian Federation, 2019 (N = 150).
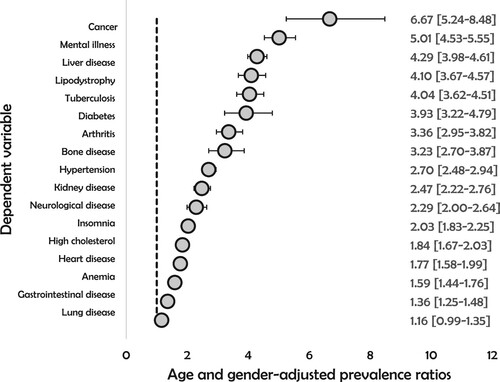
Table 2. Percentage of people living with HIV in Russia who reported various treatment related challenges, overall and by drug use behavior, Russia, 2019 (N = 150).
Figure 2. Percentage of people living with HIV in Russia who reported different reasons for missing HIV medication for varying number of times in the past month, 2019 (N = 150).
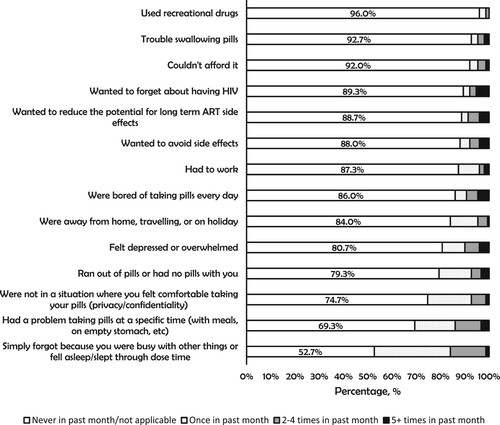
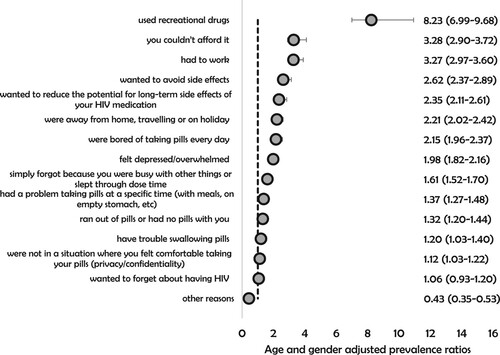
Figure 3. Adjusted prevalence ratios for the relationship between self-reported substance use disorder and reasons for missing HIV medication for at least one time within the past month among people living with HIV in the Russian Federation, 2019 (N = 150).