
Figures & data
Figure 1. Participant inclusion flowchart.
Note. MSM = men who have sex with men. *Excluded as they did not speak/understand Dutch fluently. **One person was excluded as his IQ was indicated to be too low to properly follow the intervention content, another was excluded as he mentioned not being able to attend most of the intervention sessions. ***Both participants dropped out as they were not able to attend the intervention sessions anymore due to planning issues.
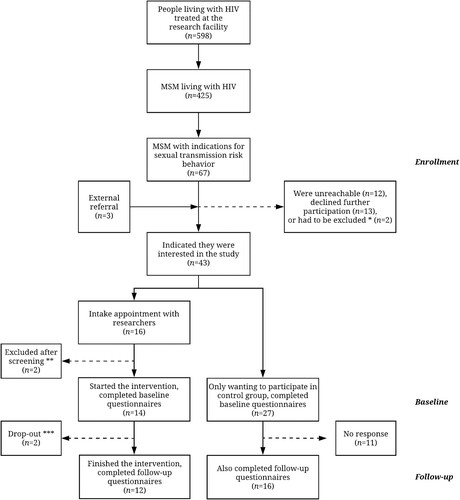
Table 1. Descriptives of intervention (n = 12) and control (n = 16) participants at baseline.
Figure 2. Comparison of sexual transmission risk behavior between the intervention group and the control group.
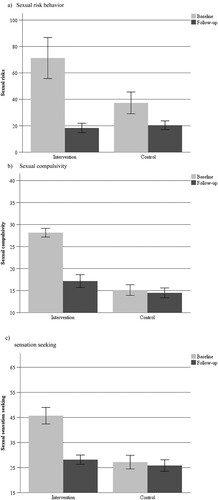
Table 2. Changes in sexual transmission risk behavior, impulsivity, mental health, and functional impairment among groups over time.
Data availability
The data that support the findings of this study are available on request from the corresponding author.