Figures & data
Figure 1. Data analysis plan.
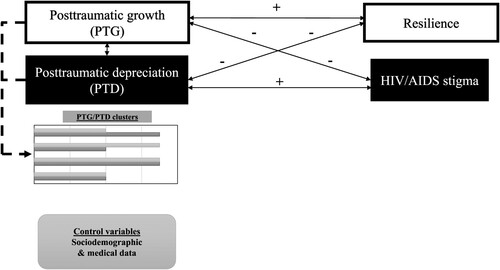
Table 1. Socio-demographic variables in the studied sample (N = 509).
Table 2. Descriptive statistics for the analyzed variables.
Figure 2. Profiles of PTG and PTD in extracted clusters.
Note: The figure presents the standardized values of PTG and PTD in the extracted clusters.
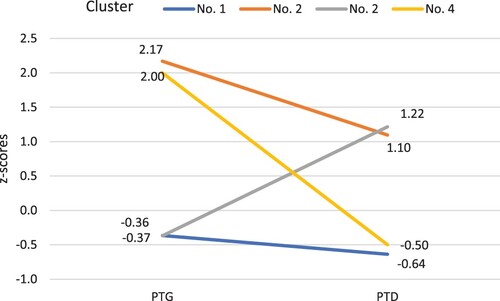
Table 3. Statistically significant relationships between extracted clusters and socio-medical data.
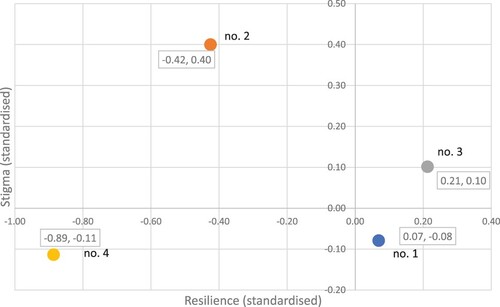
Figure 3. Standardized values of discriminant functions representing stigma and resilience in extracted clusters.