
Figures & data
Table 1. Patients’ baseline characteristics.
Table 2. Characteristics of ART timing initiation and prescription.
Table 3. Median time to viral suppression and rates of retention in care during follow-up.
Figure 1. Time from ART starts to virological response (HIV RNA < 50 copies/ml) according to different timings of initiation (rapid, intermediate and late).
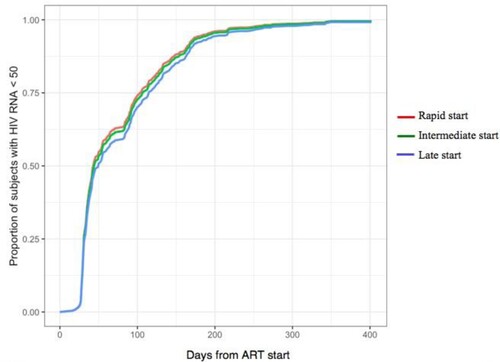
Table 4. Rates of viral suppression according to the ART initiation.
Table 5. Multivariable Cox Proportional Hazard model for Predictors of viral suppression.