Publication Cover
AIDS Care
Psychological and Socio-medical Aspects of AIDS/HIV
Volume 36, 2024 - Issue 2
1,900
Views
0
CrossRef citations to date
0
Altmetric
Research Article

Dynamics of overdose and non-overdose mortality among people living with HIV amidst the illicit drug toxicity crisis in British Columbia

ORCID Icon, , , , ORCID Icon, , , , ORCID Icon, , ORCID Icon, & show all
Pages 263-271 | Received 07 Jan 2022, Accepted 20 Mar 2023, Published online: 24 Apr 2023

Figures & data

Table 1. Mortality due to overdose and non-overdose causes among PLWH in BC (n = 9180) from 2009/2010 to 2016/2017.

Table 2. Mortality rates among PLWH in BC from 2009/2010 to 2016/2017.

Figure 1. Age-standardized annual mortality trends from 2009/2010 to 2016/2017, divided by overdose versus non-overdose deaths. Note: Fiscal year is the period between 01 April of the previous year and March 31 of the year indicated in the y-axis, e.g., year 2017 indicates the period from 01 April 2016 to 31 March 2017. Note: Standardization was performed using direct method and based on the 2016 Canadian population as a reference. Note: Counts of overdose deaths for age categories <30 and 65+ were sparse. Therefore, age categories <30 and 30–49, and, separately, 50–64 and 65+ were combined, i.e., age-adjusted categories for the purpose of annual trend were defined as <50 and 50+. Abbreviations: PYs: person-years.

Figure 1. Age-standardized annual mortality trends from 2009/2010 to 2016/2017, divided by overdose versus non-overdose deaths. Note: Fiscal year is the period between 01 April of the previous year and March 31 of the year indicated in the y-axis, e.g., year 2017 indicates the period from 01 April 2016 to 31 March 2017. Note: Standardization was performed using direct method and based on the 2016 Canadian population as a reference. Note: Counts of overdose deaths for age categories <30 and 65+ were sparse. Therefore, age categories <30 and 30–49, and, separately, 50–64 and 65+ were combined, i.e., age-adjusted categories for the purpose of annual trend were defined as <50 and 50+. Abbreviations: PYs: person-years.

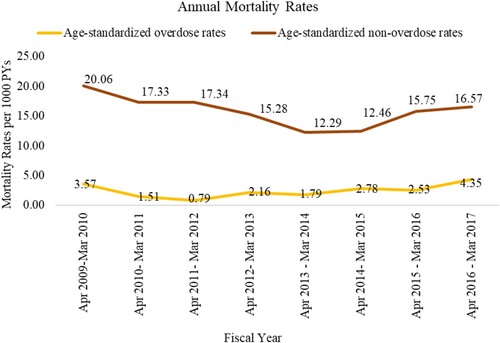
Table 3. Comparison of health-related characteristics among people who died of overdose versus non-overdose causes from 2009/2010 to 2016/2017.

Table 4. Comparison of prescription history between PLWH who died of overdose versus non-overdose from 2009/2010 to 2016/2017, stratified by sex.

Supplemental material

Supplemental Material

Download MS Word (2 MB)

Supplemental Material

Download MS Word (156 KB)