
Figures & data
Figure 1. Study participants involved. Footnote; LTF = Lost to follow-up.
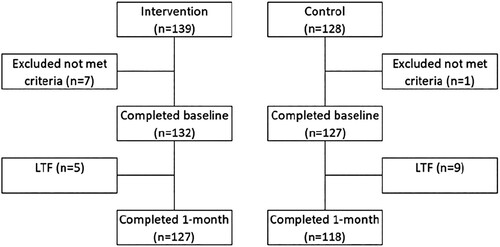
Table 1. Baseline characteristics of study participants (N = 259).
Table 2. HIV testing experience and history among study participants at baseline (N = 259).
Table 3. Acceptability of HIV testing between intervention and control arm after one-month follow-up.
Figure 2. Uptake of the HIV oral self-testing kit in the intervention arm (N = 127). Footnote; -ve = negative, +ve = positive, OST = oral self-testing.
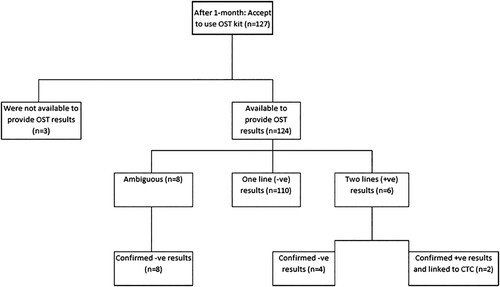
Table 4. Experience of the HIV oral self-testing kit in the intervention arm (N = 127).
