Figures & data
Figure 1. ‘U.S. Total Enrollment, Fall Semester 1947–2012’. Source: National Center for Education Statistics (NCES) Digest of Education Statistics, 2013.
Figure 2. ‘Total Fall Enrollment by Sex and Ethnicity, selected years 1976–2012’. Source: National Center for Education Statistics (NCES) Digest of Education Statistics 2013.
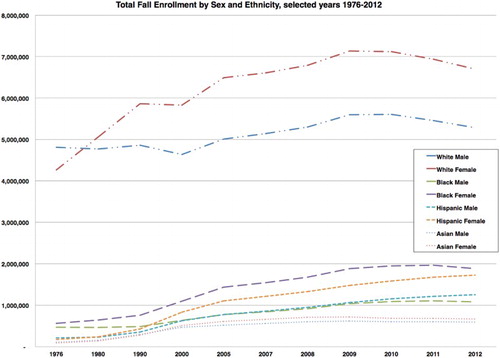
Figure 3. Fall Semester Enrollment by Sex, 1966–2014. Source: Office of the Registrar/University of Texas Office of Information Management and Analysis.
Figure 4. ‘US Total Undergraduate Fall Enrollment in Degree-Granting Postsecondary Institutions by Attendance Status’. Source: Table 303.70, “Total undergraduate fall enrollment in degree-granting postsecondary institutions, by attendance status, sex of student, and control and level of institution: selected years, 1970 through 2023” National Center for Education Statistics (NCES) Digest of Educational Statistics. Note: * All values after 2014 are projected.