
Figures & data
Table 1. Characteristics of the participants (n = 53).
Figure 1. Study design flowchart.
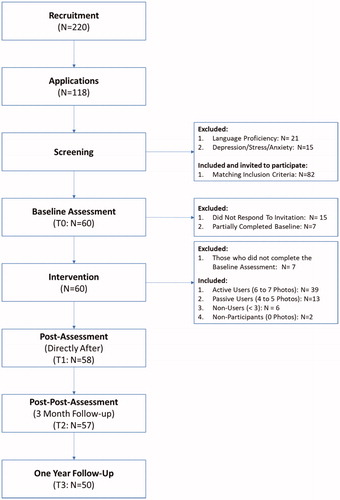
Table 2. Descriptive statistics, and Cronbach Alphas.
Table 3. Bayesian latent growth model fit statistics.
Figure 2. Predicted means for Satisfaction with Life, and Meaning in Life.
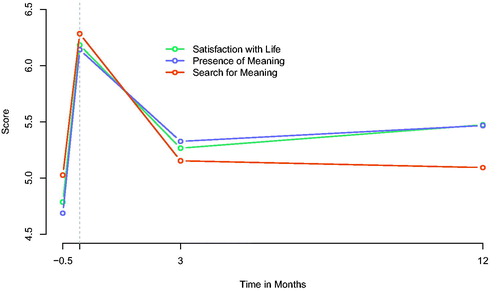
Figure 3. Estimated means for Gratitude with Default Priors.
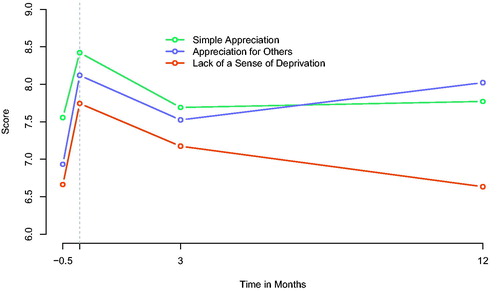
Figure 4. Predicted means for Stress, Depression and Anxiety.
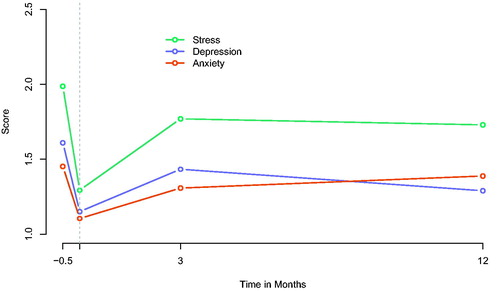
Table 4. Bayesian latent growth changes and effect sizes with Steger et al.’s (Citation2014) priors.
Table 5. Sensitivity analysis.
Table 6. Bayesian Latent Growth changes with default priors.
Table 7. Model fit difference: models with Steger et al.’s priors—default priors.
Supplemental material