
Figures & data
Figure 1. Hypothesized structural model. Note. Paths predicted to be positive are marked with a (+) and paths that are negative are marked with a (−).
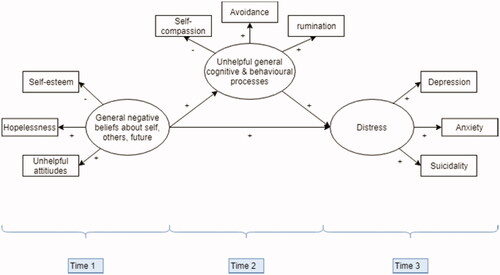
Table 1. Demographic information on the participants.
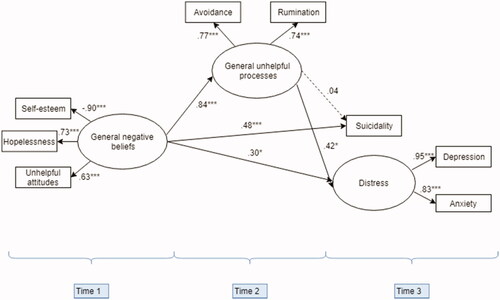
Figure 2. Final model. Structural equation model of the associations between general negative beliefs, psychological and behavioural responses, and distress. Note. Solid lines represent significant paths, dashed lines represent non-significant paths. All paths represent standardized estimates. Error terms were omitted from the model for coherence. *p<.05, **p<.01, ***p<.001.
Supplemental material