
Figures & data
Figure 1. Hypothesised path model.
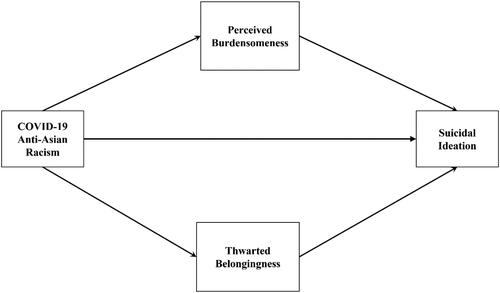
Figure 2. Estimated path model.
Note. *p < .05, **p < .01, ***p < .001.
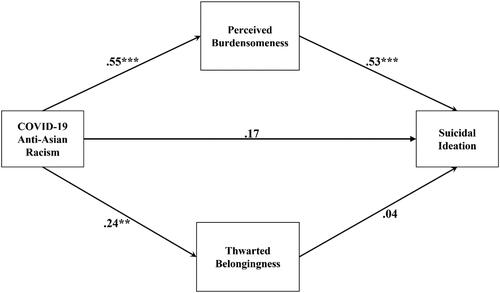
Table 1. Participant demographics (N = 139).
Table 2. Descriptive statistics and bivariate correlations of study variables.
Table 3. Estimate of indirect effects from bootstrap analysis.
Data availability statement
Data may be available upon request from the first author.