
Figures & data
Table 1. Student Wellbeing and Experiential Learning Spaces (SWELS) quantitative data demographics (n = 140).
Figure 1. UCL MASc Creative Health students engaging in object-based learning for wellbeing at UCL’s Object-based Learning Lab. (Photo: Thomas Kador).
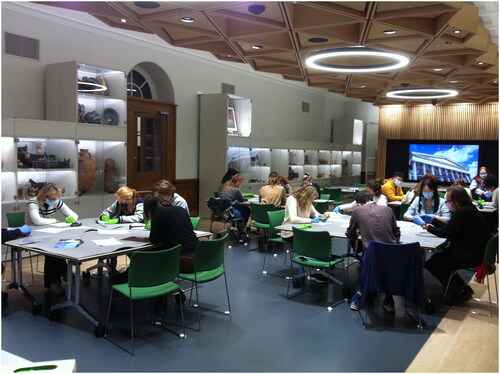
Figure 2. Dental students from King’s College Clinical Humanities & Wellbeing module closely observing and improving their haptic skills through drawing at the Gordon Museum, London. (Photo: Flora Smyth Zahra).
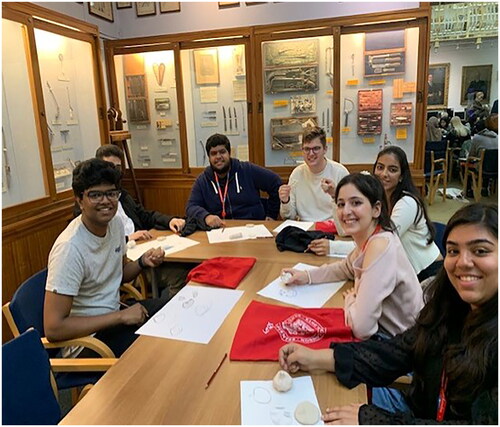
Figure 3. Expo tab on the online platform Hopin from Ashmolean Museum (ISO)Lates event, 29 April 2021 © Ashmolean Museum, University of Oxford.

Table 2. Mean and standard deviation of ONS wellbeing questions by university.
Figure 4. Proportional breakdown of SWELS survey participants ONS4 wellbeing scores compared to the national average at the same time point for the same age.
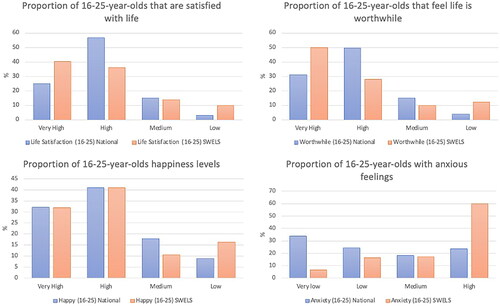
Table 3. Mean and standard deviation of Harvard Flourishing Scale by university.
Figure 5. Survey participants activity levels in experiential learning spaces pre and post COVID-19.
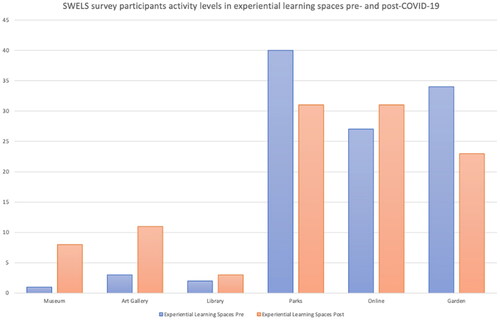
Figure 6. Survey participants activity levels in experiential learning spaces pre- and post- COVID-19 by university.
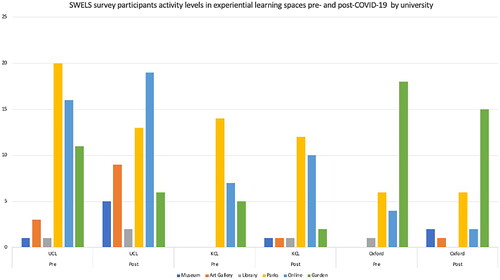
Table 4. Student Wellbeing and Experiential Learning Spaces qualitative data Demographics (n = 14).
Table 5. Themes and illustrative quotes from the qualitative analysis.
Supplemental Material
Download MS Word (1.6 MB)Data availability statement
Data has been deposited with the UK Data Service and will be made publicly available after publication of this article.