
Figures & data
Table 1. Sub-categories to record ISCs according to the Conférence Cantonale des Directeurs des Finances (1981).
Table 2. Summary statistics of the regression dataset.
Table 3. Average share of ISC recorded in each subcategory.
Figure 1. Share of precise and imprecise transactions in each canton.
Note: Dark blue bars represent ‘precise’ ISC entries, meaning that they are rounded to the ten-thousandth or below, over the total number of ISC transactions. Information is taken from the general-purpose financial reports from each canton.
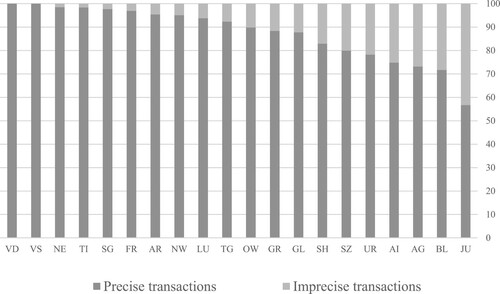
Figure 2. Number of ISC sub-categories used per canton.
Notes: Dark blue bars represent the use of subcategories 390 to 398 which are specific entries (see for detailed information). Light blue bars exhibit the use of subcategory 399 which can be considered as a residual subcategory. Sub-categories are given by CFM (Citation1982).
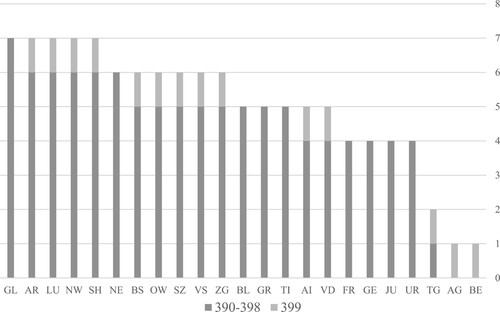
Figure 3 – ISC intensity per canton.
Notes: Intensity is computed by dividing the sum of ISCs by overall expenses. The intensity is the 2016–2018 cantonal level average. Information is taken from the general purpose financial reports for each canton. Cantons are ranked by level of intensity.
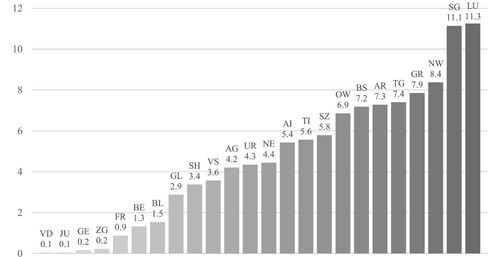
Table 4. Regression results.