Figures & data
Figure 1. (a) Location of shooting ranges sampled in the eastern and northern Botswana. (b) Map showing southern african countries.
Figure 2. Schematic of sampling points in the shooting range.
Table 1. Risk assessment code (RAC) and corresponding pollution risk level [Citation22].
Table 2. Ecological risk index and resultant ecological risk level [Citation26].
Table 3. Classification of pollution risk into Igeo grades [Citation27].
Table 4. Classification of individual metal contamination level [Citation29].
Table 5. Categories of level of soil enrichment from Pb [Citation29].
Table 6. Eco-toxicity and bioavailability of Pb in the different fractions [Citation31].
Figure 3. RAC of Pb in berm soils of seven shooting ranges found in eastern and nothern Botswana. Mean of n = 3; Standard error of the mean, δ= δ/√n, where δ = standard deviation.
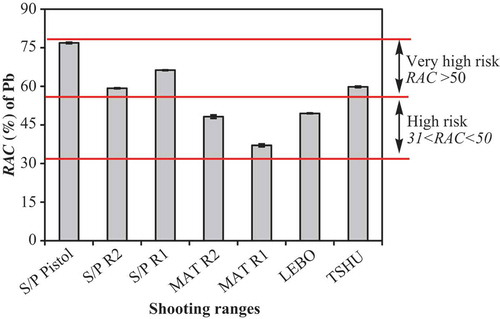
Figure 4. Potential ecological risk index (EPbr) of berm soil Pb of seven shooting ranges found in eastern and nothern Botswana. Mean of n = 3; Standard error of the mean, δ = δ/JK, where δ = standard deviation.
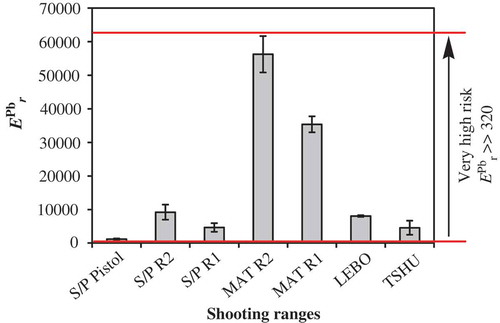
Figure 5. Geoaccumulation index (Igeo) of berm soil Pb of seven shooting ranges found in eastern and nothern Botswana. Mean of n = 3; Standard error of the mean, δ = δ/√n, where δ = standard deviation.
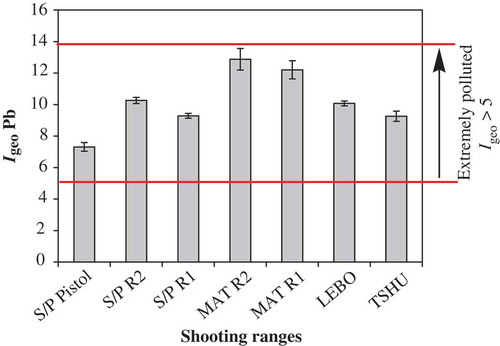
Figure 6. Contamination factor (CF) of berm soil Pb of seven shooting ranges found in eastern and nothern Botswana. Mean of n = 3; Standard error of the mean, δ = δ/√n, where δ = standard deviation.
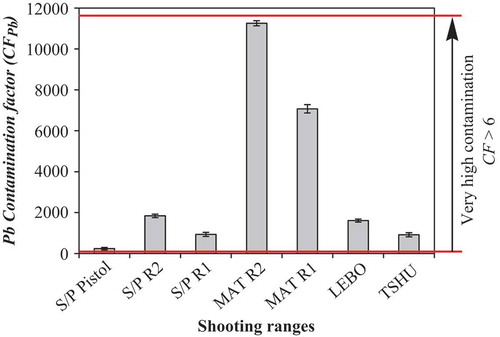
Figure 7. Enrichment factor (EF) of berm soil Pb of seven shooting ranges found in eastern and nothern Botswana. Mean of n = 3; Standard error of the mean, δ = δ/√n, where δ = standard deviation.
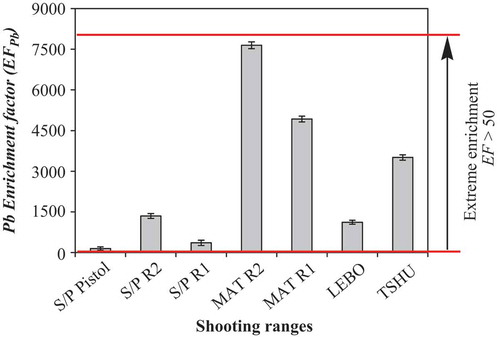
Table 7. Pearson correlation coefficient (r) range and corresponding significance [Citation24].
Figure 8. Pearson correlation between; (a) soil pH; (b) soil organic matter and (c) soil CEC to total Pb concentration of seven shooting ranges found in eastern and nothern Botswana. Mean of n = 3; Standard error of the mean, δ = δ/√n, where δ = standard deviation.