
Figures & data
Table 1. Generic set of ideas with ‘missing attributes'. Different ideas for each attribute (A1, A2, A3) are coded with a different symbol.
Table 2. Individual novelty values calculated by applying and
on the generic set of Table .
Figure 1. Additional example to demonstrate how both SNM and SNM’ cannot correctly deal with missing attributes. Idea A appears 99 times, while Idea B only one time.
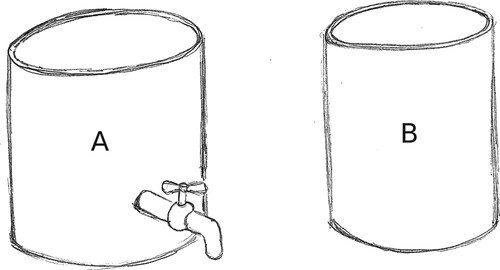
Table 3. Individual novelty values calculated by applying on the generic set of Table . The values from
are also reported for a direct comparison.
Table 4. Attributes (Att.) identified by the evaluators and related weights (W). From Fiorineschi, Frillici, and Rotini (Citation2020b).
Figure 2. Examples of some sketches of ladders produced by students. Idea ‘26' is a sort of elevator (only two in the whole set) activated by a rope. Idea ‘63' is based on a common ladder but is the sole mentioning the possibility to support clothes. Idea ‘86' uses an inflatable structure.
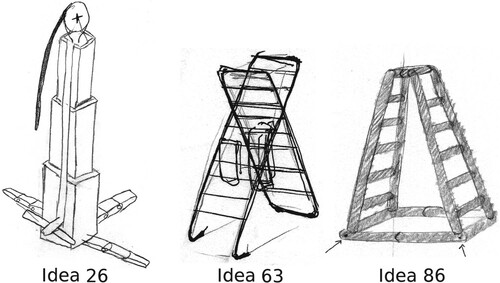
Table 5. Codification of Idea 26 (see Figure ), according to the three evaluators.
Table 6. Codification of Idea 63 (see Figure ), according to the Three evaluators.
Table 7. Codification of Idea 86 (see Figure ), according to the Three evaluators.
Figure 3. Novelty values obtained by EV1 with the two metrics. Perfect ‘zero' values indicate that the specific evaluator was unable to assess the specific idea.
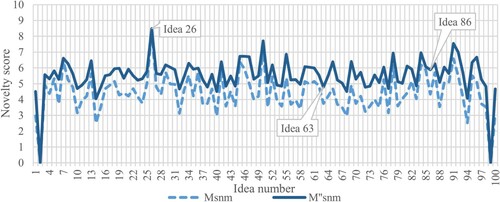
Figure 4. Novelty values obtained by EV2 with the two metrics. Perfect ‘zero' values indicate that the specific evaluator was unable to assess the specific idea.
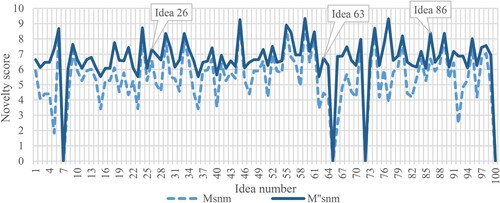
Figure 5. Novelty values obtained by EV3 with the two metrics. Perfect ‘zero' values indicate that the specific evaluator was unable to assess the specific idea.
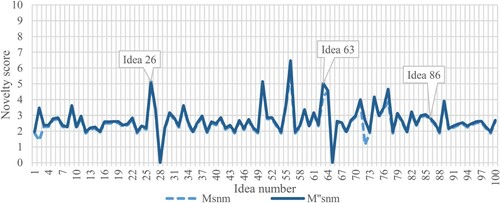
Table 8. Individual novelty values of ideas shown in Figure . The values are also graphically shown in Figures .
Table 9. Overall assessment results for the three evaluators.
Figure A1. Ladder examples provided to students by means of projected slides.

Figure A2. Same graph shown in Figure , where the novelty values have been obtained by using the same weight for each attribute.
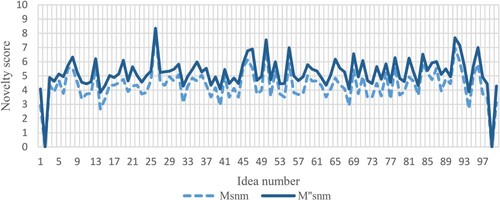
Figure A3. Same graph shown in Figure , where the novelty values have been obtained by using the same weight for each attribute.
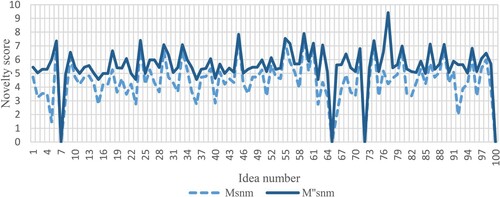
Figure A4. Same graph shown in Figure , where the novelty values obtained are calculated by using the same weight for each attribute.
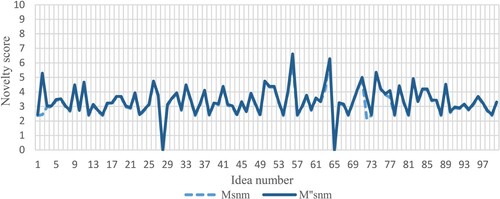
Table A1. Design requirements provided to students.