
Figures & data
Figure 1. Patient flow diagram.
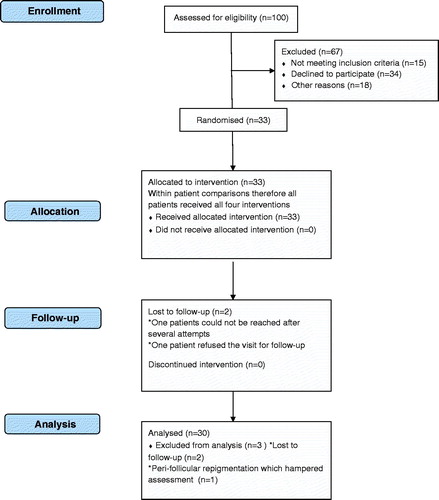
Table 1. Baseline characteristics of study population.
Figure 2. Total pigmented surface area of 4 grafts per treatment region. Data represent median; IQR (50.3 mm2, 33.0 mm2, 29.1 mm2 and 23.6 mm2 in respectively 1.5 mm deep grafts, 1.5 mm superficial grafts, 1 mm superficial grafts and 1 mm deep grafts.) p < 0.001, calculated with the related samples of Friedman’s two-way analysis of variance by ranks. N = 30.
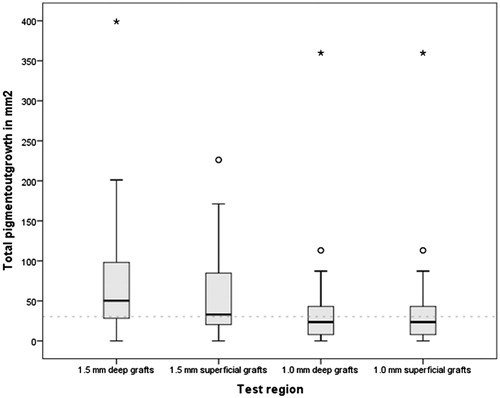
Table 2. PGA of the general outcome of both donor and recipient sites 6 months after grafting.
Table 3. Side effects in the donor and recipient sites.