Figures & data
Table 1. Demographics and baseline disease characteristics.
Figure 1. Overall satisfaction with the three-part treatment regimen of benzoyl peroxide 5% gel in combination with liquid cleanser and moisturizer SPF 30.
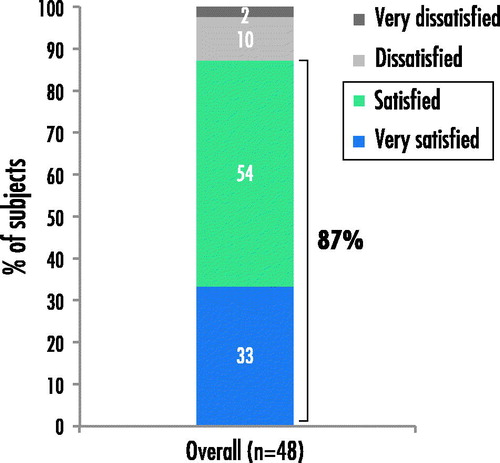
Figure 2. Cosmetic aspects and positive effects of (a) the liquid cleanser and (b) the moisturizer SPF 30.
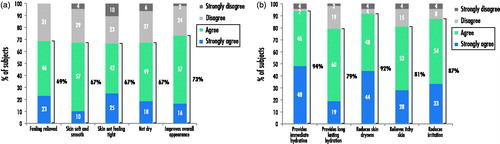
Figure 3. Subject questionnaire responses when asked whether the liquid cleanser and moisturizer SPF 30 (a) helped subjects to continue with the treatment and (b) is needed as part of acne treatment.
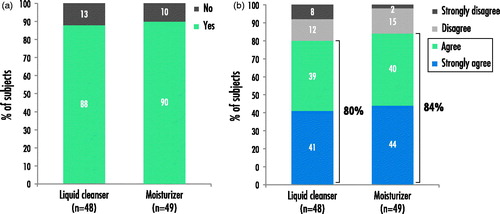
Figure 4. Median percent change from baseline in (a) total, (b) inflammatory and (c) non-inflammatory lesion counts.
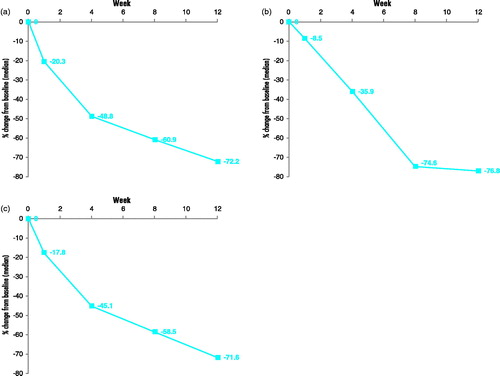
Figure 5. Global investigator-assessed improvement at week 12.
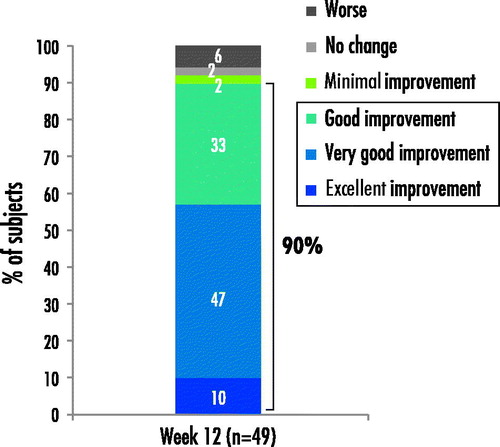
Figure 6. Reduction in Propionibacterium acnes activity from week 1 onwards, as shown by (a) percentage change from baseline in the number of orange fluorescence pixels and (b) representative photographs of UV fluorescence image analysis.
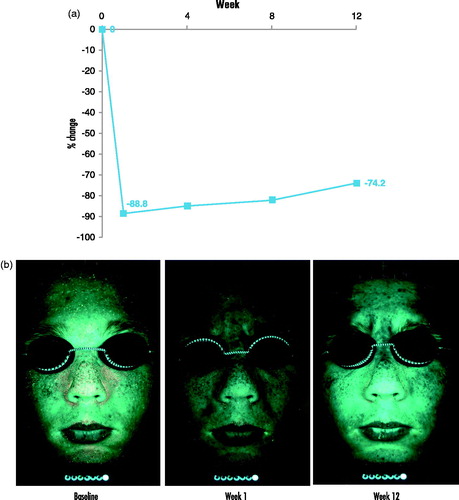
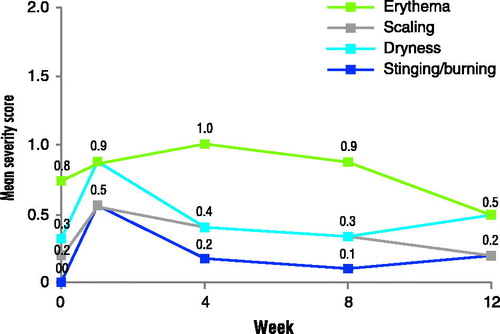
Figure 7. Mean severity of local tolerance over the 12-week treatment period. A score of 1 indicates a mild reaction.