
Figures & data
Table 1. Baseline characteristics of the volunteers.
Figure 1. Box plot of visually assessed skin blanching scores at 2 h after treatment application for 16 h.The box plot shows the median (horizontal lines), range (boxes), 1.5× interquartile range (whiskers) and mean (circles). BD: betamethasone dipropionate 0.05%; Cal/BD: calcipotriol 50 μg/g and betamethasone dipropionate 0.5 mg/g; CP: clobetasol propionate 0.05%; HB: hydrocortisone-17-butyrate 0.1%; MF: mometasone furoate 0.1%; vehicle, foam vehicle.
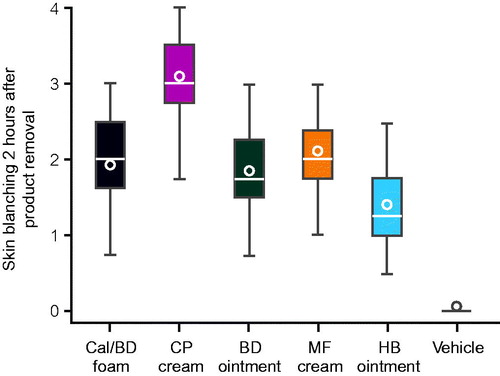
Table 2. Visually assessed skin blanching scores at 2 h after non-occlusive application of the treatments for 16 hTable Footnotea (N = 36).
Table 3. Results of analysis of variance of visually assessed skin blanching scores (N = 36).