Figures & data
Figure 1. Dose-response curves for drugs A-D. Increasing drug potency decreases half maximal effective concentration (EC50).
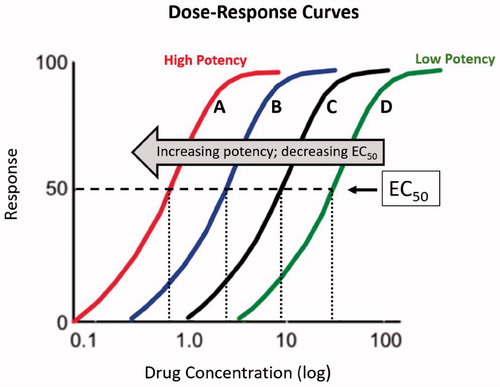
Figure 2. PASI 90 response over time in ECLIPSE study (Citation2). The efficacy of both drugs is similar at weeks 16 through 20, and then favors guselkumab to week 48. Speed of response illustrated using PASI9050, favors secukinumab by more than one week.
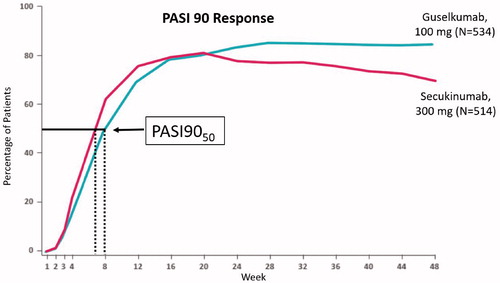
Figure 3. Concentration-response curves illustrating the concept of potency. For a response of 25%, Drug B is more potent. For a response of 75%, Drug A is more potent.
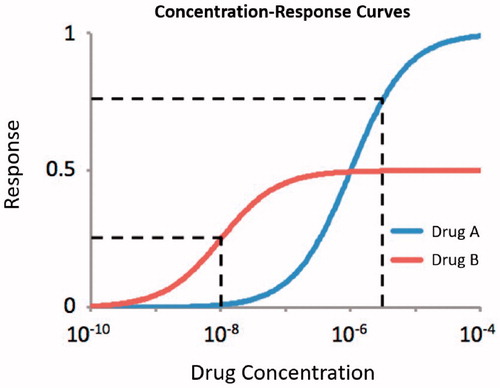
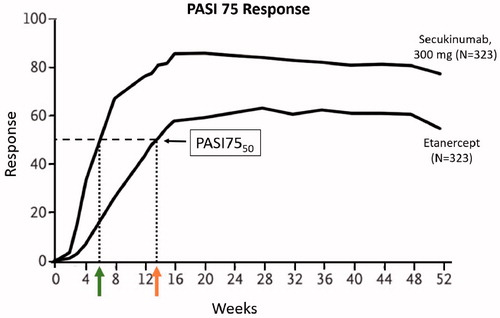
Figure 4. PASI 75 response over time in FIXTURE study.3 Green and orange arrows indicate weeks to PASI7550 for secukinumab 300 mg and etanercept respectively. Secukinumab 300 mg achieved PASI7550 in less than 6 weeks compared to more than 13 weeks for etanercept.