
Figures & data
Figure 1. Study design and patient disposition. aPatients had multiple reasons for withdrawal.
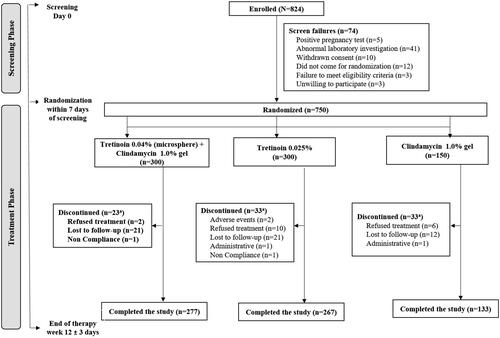
Table 1. Patient baseline demographics and clinical characteristics by treatment groups (ITT population).
Figure 2. Comparison of mean percentage change in inflammatory, non-inflammatory and total lesion counts between treatment groups (ITT analysis set). †††p < .001 combination vs. clindamycin monotherapy; *p < .05, **p < .01 combination vs. tretinoin monotherapy. ITT: intent-to-treat.
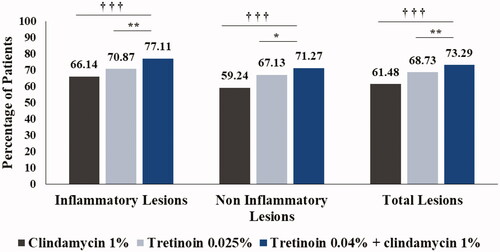
Table 2. Primary and secondary efficacy endpoints (ITT population).
Figure 3. Comparison of physician’s global evaluation of efficacy (ITT analysis set). ITT: intent-to-treat.
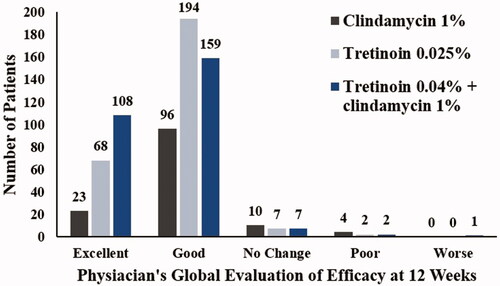
Table 3. Summary of adverse events.
Supplemental material