
Figures & data
Table 1. Demographic and baseline clinical characteristics.
Figure 1. Clinical scores of all patients during 16 weeks of treatment with topical ivermectin and at week 28 (follow-up). (a–e) IGA scale, IGA success scale (IGA 0 or 1), papules and pustules scale, erythema scale, and telangiectasia scale. (f) Number of facial inflammatory lesions, expressed as median with range. IGA: investigator’s global assessment.
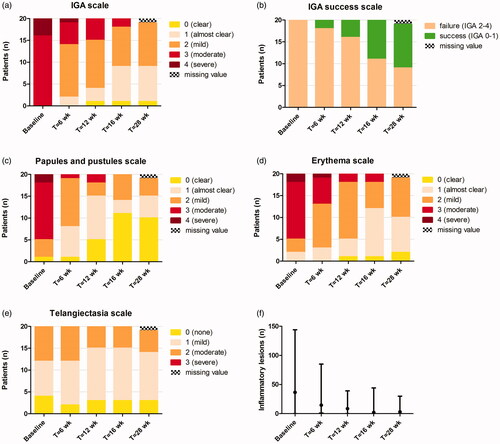
Figure 2. Rosacea in a 56-year old man, (a) at baseline, (b) at week 16 of treatment with topical ivermectin 1% once daily, and (c) 12 weeks post-treatment. Notice the disappearance of papules and pustules at the forehead and prominent erythema at the cheeks, while telangiectasias and residual erythema at both cheeks are persisting. The green dots serve as a tool to assess clinical erythema.
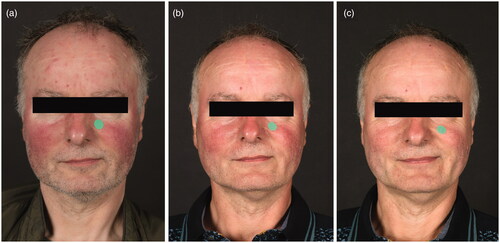
Figure 3. Demodex mites during 16 weeks of treatment with topical ivermectin and at week 28 (follow-up), measured with RCM. (a) Mite presence per 8x8 mm2, expressed as present or absent. (b) Number of mites per 8 × 8 mm2, expressed as median with range.
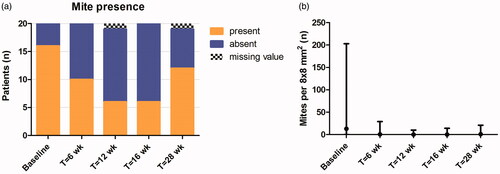
Figure 4. Confocal images of the cheek (0.5 × 0.5 mm2). (a) Follicle at the level of the stratum granulosum containing seven Demodex mites, clearly visible as bright, round contours. (b) Follicle at the level of the stratum granulosum with unclear content due to vague, white-roundish structures, included in mite category doubt. (c) Multiple bright, round to oval or fusiform cells with dendritic processes at the level of the dermo-epidermal junction, possibly melanocytes or Langerhans cells. (d) Multiple bright, round cells at the level of the dermo-epidermal junction, possibly inflammatory cells.
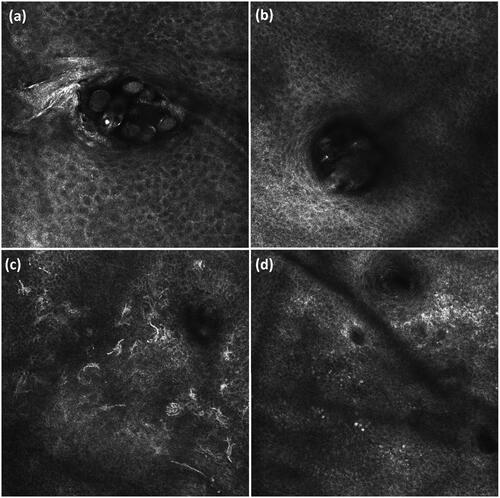
Table 2. Mite and follicle numbers per 8 × 8 mm2.
Figure 5. (a) Vascular diameter and (b) vascular density scores during 16 weeks of treatment with topical ivermectin and at week 28 (follow-up), determined with RCM.
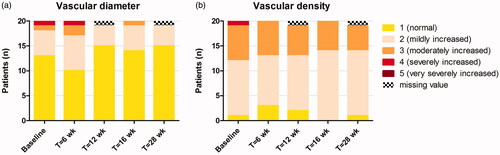
Table 3. Inflammatory parameters and epidermal thickness.
Table 4. Mixed model logistic regression models determining RCM features associated with clinical success (IGA 0/1).