9,278
Views
37
CrossRef citations to date
0
Altmetric
Articles

Targeted therapies for patients with moderate-to-severe psoriasis: a systematic review and network meta-analysis of PASI response at 1 year

, , , , &
Pages 204-218 | Received 04 Nov 2019, Accepted 07 Feb 2020, Published online: 02 Apr 2020

Figures & data

Figure 1. PRISMA flow diagram of SLR and NMA.

Figure 1. PRISMA flow diagram of SLR and NMA.

Figure 2. Network diagram of PASI responses - analysis 1 and analysis 2.

ADA: adalimumab; APR: apremilast; BRO: brodalumab; CZP: certolizumab pegol; ETN: etanercept; GUS: guselkumab; INF: infliximab; IXE: ixekizumab; PBO: placebo; SEC: secukinumab; RIS: risankizumab; UST WBD: ustekinumab weight-based dose.

Figure 2. Network diagram of PASI responses - analysis 1 and analysis 2.ADA: adalimumab; APR: apremilast; BRO: brodalumab; CZP: certolizumab pegol; ETN: etanercept; GUS: guselkumab; INF: infliximab; IXE: ixekizumab; PBO: placebo; SEC: secukinumab; RIS: risankizumab; UST WBD: ustekinumab weight-based dose.

Table 1. Baseline characteristics of studies included in the primary analysis and the secondary analysis.

Figure 3. Results of predicted percentage PASI 75, 90, and 100 responses for evaluated interventions (Analysis 1).

Q2W: every 2 weeks; Q4W: every 4 weeks; WBD: weight-based dose.

Figure 3. Results of predicted percentage PASI 75, 90, and 100 responses for evaluated interventions (Analysis 1).Q2W: every 2 weeks; Q4W: every 4 weeks; WBD: weight-based dose.

Figure 4. Analysis 1: Relative treatment effect for all interventions. Relative effects are plotted as the median difference in response on the probit scale, where positive values indicate greater efficacy for the intervention and negative values indicate greater efficacy for the comparator.

ADA: adalimumab; BRO: brodalumab; ETN: etanercept; GUS: guselkumab; IXE: ixekizumab; SEC: secukinumab; RIS: risankizumab; UST: ustekinumab weight-based dose.

Figure 4. Analysis 1: Relative treatment effect for all interventions. Relative effects are plotted as the median difference in response on the probit scale, where positive values indicate greater efficacy for the intervention and negative values indicate greater efficacy for the comparator.ADA: adalimumab; BRO: brodalumab; ETN: etanercept; GUS: guselkumab; IXE: ixekizumab; SEC: secukinumab; RIS: risankizumab; UST: ustekinumab weight-based dose.

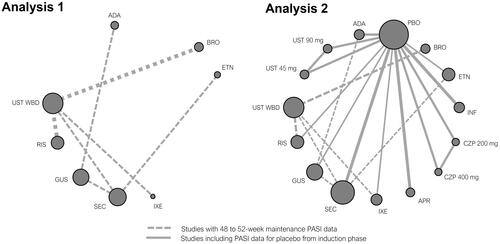
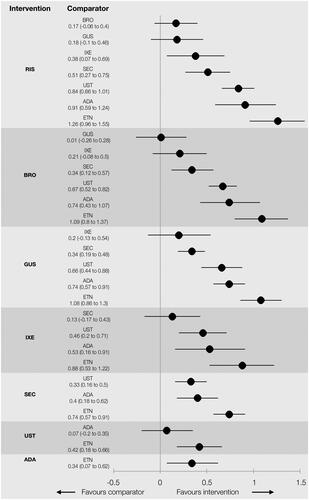
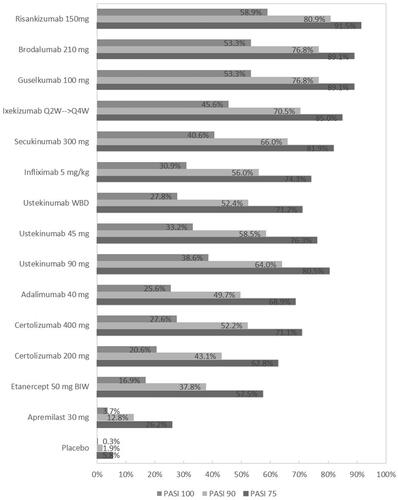
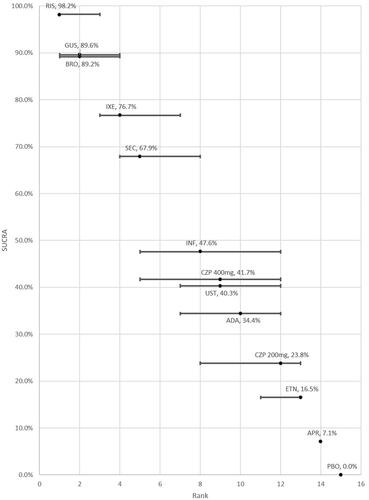
Table 2. NMA of 52-week active therapy RCTs (Analysis 1): results for PASI response.

Figure 5. Results of predicted percentage PASI 75, 90, and 100 responses for evaluated interventions (Analysis 2).

Q2W: every 2 weeks; Q4W: every 4 weeks; WBD: weight-based dose

Figure 5. Results of predicted percentage PASI 75, 90, and 100 responses for evaluated interventions (Analysis 2).Q2W: every 2 weeks; Q4W: every 4 weeks; WBD: weight-based dose

Table 3. NMA of 52-week RCTs using induction phase placebo control (Analysis 2): results for PASI responses.

Figure 6. SUCRA and ranking with error bars indicating the 95% credible interval (Analysis 2).

ADA: adalimumab; BRO: brodalumab; ETN: etanercept; GUS: guselkumab; IXE: ixekizumab; SEC: secukinumab; RIS: risankizumab; UST: ustekinumab weight-based dose

Figure 6. SUCRA and ranking with error bars indicating the 95% credible interval (Analysis 2).ADA: adalimumab; BRO: brodalumab; ETN: etanercept; GUS: guselkumab; IXE: ixekizumab; SEC: secukinumab; RIS: risankizumab; UST: ustekinumab weight-based dose
Supplemental material

Supplemental Material

Download Zip (834.2 KB)