
Figures & data
Figure 1. TRANSITION study design. CsA: Cyclosporine A.
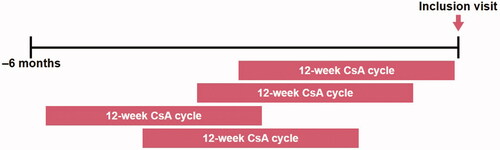
Table 1. Demographics and baseline characteristics.
Table 2. Medical history: current medical condition of patients.
Table 3. Reasons for permanent discontinuation from the last CsA cycle.
Figure 2. Percentage of partial- and suboptimal-responder patients. Non-responder: PASI response <50%; Partial Responder: PASI response is between 50% and <75%; Suboptimal Responder: PASI response is between 75% and <90%; Responder: PASI response ≥90%; N: number of evaluable patients; n: number of patients who satisfied the criteria; PASI: Psoriasis Area and Severity Index.
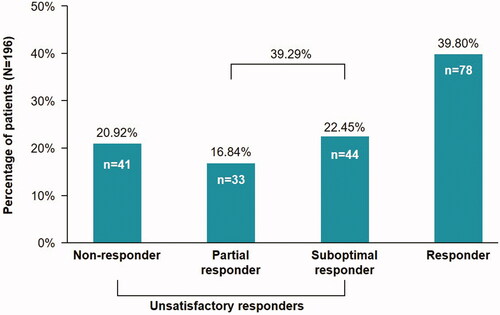
Figure 3. PASI score over time. CsA, cyclosporine A; ΔPASI, change in Psoriasis Area and Severity Index score between assessments.
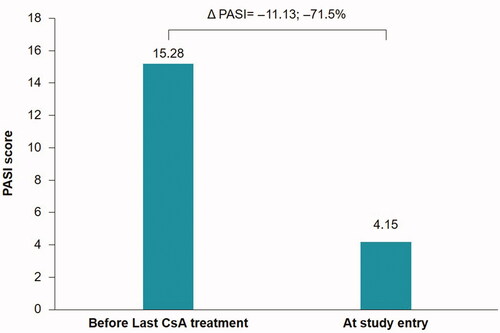
Figure 4. Percentage of patients with DLQI 0/1 by PASI response. DLQI: Dermatology Life Quality Index; PASI: Psoriasis Area and Severity Index.
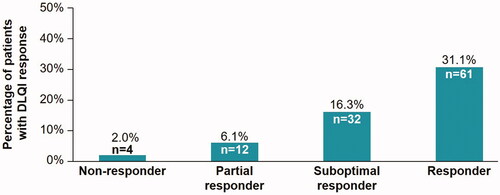
Figure 5. Treatment Satisfaction Questionnaire of Medication. Mean (SD) TSQM Domain scores are reported. SD: standard deviation; TSQM: Treatment Satisfaction Questionnaire of Medication.
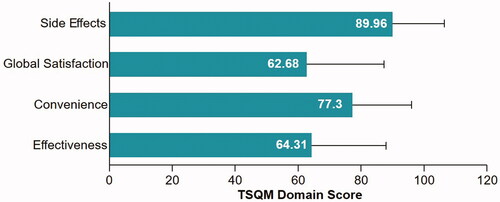
Table 4. Correlation between PASI score and each domain of TSQM, using the Spearman correlation coefficient.