
Figures & data
Figure 1. Percent PASI improvements from baseline to week 28 by week 28 PASI response subgroup. Percent values by the end of each line represent the percentage of patients in each week 28 PASI category. PASI responders were defined as patients with PASI ≥75, super responders as patients with PASI ≥90, partial responders as patients with PASI 50–74, and nonresponders as patients with PASI <50 improvement at week 28. CI: confidence interval; PASI: Psoriasis Area and Severity Index.
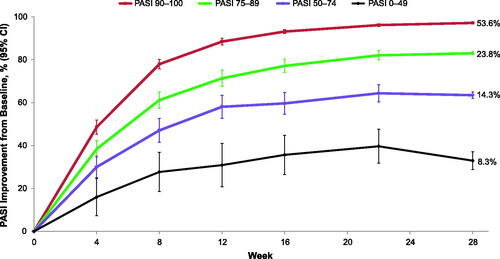
Table 1. Baseline demographic and clinical characteristics.
Figure 2. Week 16 PASI responses are predictive of week 28 nonresponders/partial responders (PASI <75). PASI responders were defined as patients with PASI ≥75, super responders as patients with PASI ≥90, partial responders as patients with PASI 50–74, and nonresponders as patients with PASI <50 improvement at week 28. PASI: Psoriasis Area and Severity Index.
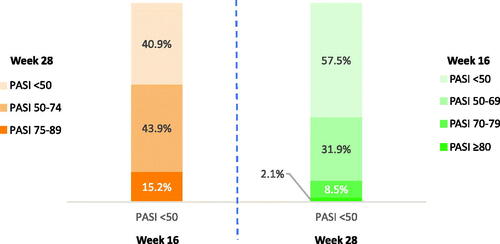
Table 2. Predictive value of week 16 PASI improvement for predicting week 28 partial responders/nonresponders (PASI <75).
Figure 3. Week 4 PASI responses are predictive of week 28 super responders (PASI ≥90) and responders (PASI ≥75). PASI responders were defined as patients with PASI ≥75, super responders as patients with PASI ≥90, partial responders as patients with PASI 50–74, and nonresponders as patients with PASI <50 improvement at week 28. PASI: Psoriasis Area and Severity Index.
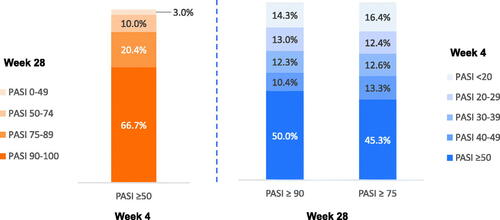
Table 3. Predictive value of week 4 PASI improvement for predicting week 28 responders (PASI ≥75) and super responders (PASI ≥90).