
Figures & data
Table 1. Baseline characteristics of PCA and PSCA patients (%).
Figure 1. Survival curves of different variables. (A) Year of diagnosis. (B) PATS: Primary anatomic tumor site. (C) Age. (D) Sex. (E) Race. (F) Grade. (G) Tumor size. (H) MPMT: Multiple primary malignant tumors. (I) Laterality. (J) Stage. (K) PSS: Primary site surgery. (L) RRLN: Removal of regional lymph nodes. (M) NPSS: Non-primary site surgery. (N) Radiotherapy. (O) Chemotherapy. (P) Radiation sequence with PSS.
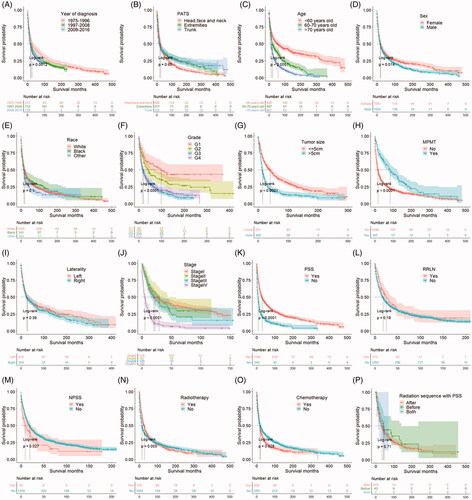
Table 2. The results of univariate and multivariate cox analysis.
Figure 2. The prognostic nomogram model of PCA and PSCA patients. MPMT: multiple primary malignant tumors; PSS: primary site surgery; RT: radiotherapy; CT: chemotherapy.
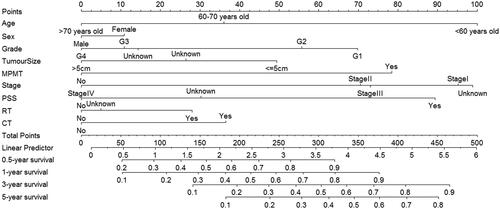
Figure 3. Calibration curves of the training set and the testing set. (A, B, C, D) Calibration curves that are created in the light of the training set sample compare predicted and actual survival proportions at (A) 0.5-year, (B) 1-year, (C) 3-year and (D) 5-year, separately. (a, b, c, d) Calibration curves that are created in the light of the testing set sample compare predicted and actual survival proportions at (a) 0.5-year, (b) 1-year, (c) 3-year and (d) 5-year, separately.
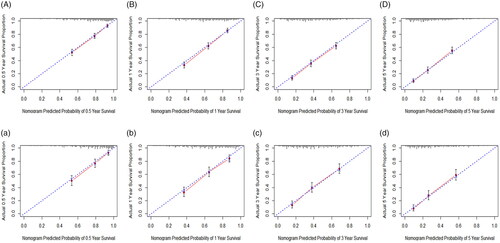
Figure 4. Survival curves of different treatment modalities in various groups. (A) Survival curves of different treatment modalities in total population group. (B) Survival curves of different treatment modalities in stage I, II and III group. (C) Survival curves of different treatment modalities in stage IV group. PSS: primary site surgery; RT: radiotherapy; CT: chemotherapy.
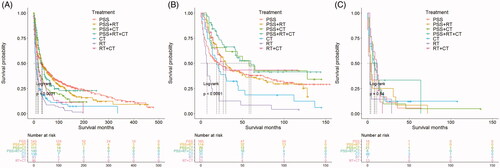
Table 3. Univariate cox analysis of different treatment modalities in various groups.
Data availability statement
Original data presented in the study are publicly available. The data can be found at the site: https://seer.cancer.gov/data/