
Figures & data
© 2022 Sanofi. Published with license by Taylor & Francis Group, LLC.
Figure 1. Patient enrollment in EUROSTAD by country.
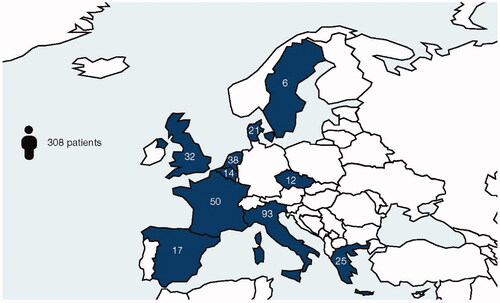
Table 1. Baseline demographics and disease characteristics.
Table 2. Systemic treatment at enrollment and during 12-month follow-up.
Figure 2. Treatment duration: Kaplan–Meier analysis of time to treatment discontinuation. Values underneath the graphs show patients with available measurements at each visit. Month 0 is the therapy start time. The X-axis represents the time (month) since the start of therapy.
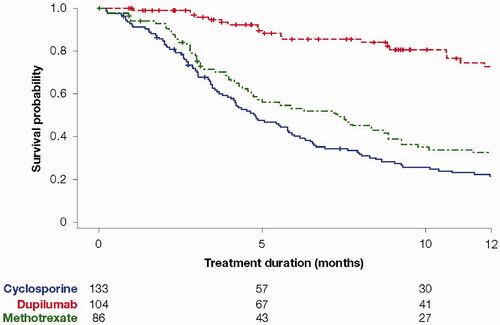
Table 3. Most common reasons for initiating or discontinuing systemic therapy.
Table 4. Change in EASI and IGA score over time from the start of EUROSTAD.
Supplemental material