
Figures & data
Figure 1. Inclusion flowchart. BT: biologic therapies; ST: systemic therapies; TT: topical therapies.
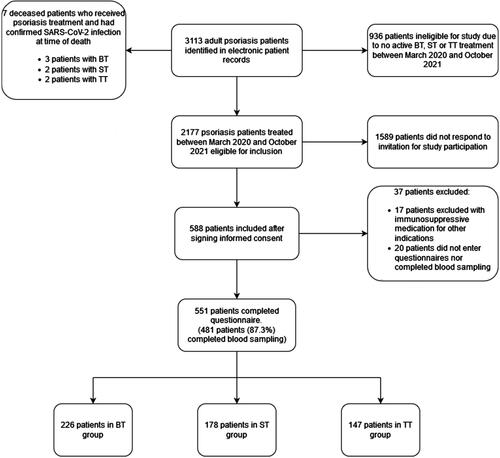
Table 1. Patient and treatment characteristics of patients included in PsoCovid (n = 551).
Table 2. Information on vaccination and infection with SARS-CoV-2 of patients included in PsoCovid – results from questionnaires (n = 551).
Table 3. Interpretation blood test (n = 551 with questionnaire completed; n = 482 with serum antibody test and questionnaire completed) per treatment group.
Table 4. SARS-CoV-2 infections and behavior split per treatment group – results of questionnaires and serum antibody tests.
Table 5. Logistic regression analysis: factors associated with SARS-CoV-2 infection (composite endpoint PCR and serum antibody confirmed cases).