
Figures & data
Table 1. Key characteristics of large-scale studies included in the 2017 unanchored MAIC (Citation16–18,Citation22).
Table 2. Summary of observed baseline characteristics from the large-scale studies included in the 2017 unanchored MAIC (Citation16–18,Citation22).
Figure 1. Comparisons of PASI 90 response rates for guselkumab vs. secukinumab based on (A) unanchored MAIC using pooled data from VOYAGE 1 and VOYAGE 2 vs. pooled data from ERASURE, FIXTURE, JUNCTURE, and FEATURE using NRI methods, and (B) head-to-head comparison in the ECLIPSE trial (Citation15,Citation26). Error bars represent 95% CI. CI: confidence interval; MAIC: matching-adjusted indirect comparison; NRI: non-responder imputation; PASI: Psoriasis Area and Severity Index.
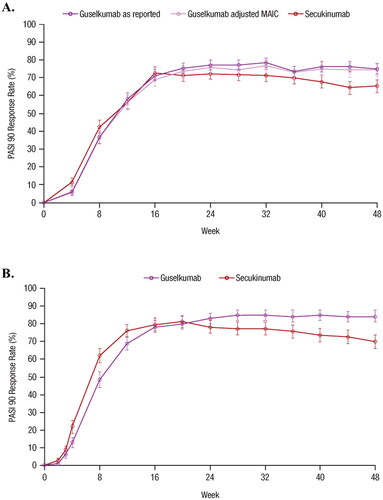
Figure 2. Forest plot of the risk differences in PASI 90 response rates over time based on results from the MAIC and the head-to-head ECLIPSE trial (Citation15,Citation26). Error bars represent 95% CI. CI: confidence interval; GUS: guselkumab; MAIC: matching-adjusted indirect comparison; PASI: Psoriasis Area and Severity Index; SEC: secukinumab.
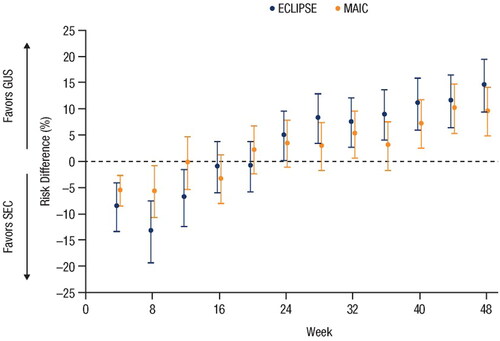
Figure 3. Comparison of guselkumab vs. ixekizumab based on PASI 90 response rates in (A) the unanchored MAIC using data from VOYAGE 1 and VOYAGE 2 vs. UNCOVER-3 through Week 156 using mNRI and NRI methods, and (B) from IXORA-R through Week 24. Error bars represent 95% CI. CI: confidence interval; MAIC: matching-adjusted indirect comparison; mNRI: modified non-responder imputation; NRI: non-responder imputation; PASI: Psoriasis Area and Severity Index.
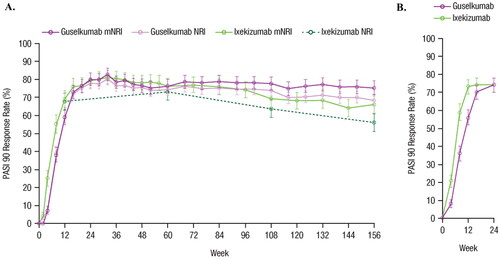
Figure 4. Forest plot of the risk differences in PASI 90 response rates over time based on results from the head-to-head IXORA-R trial using NRI methods and the unanchored MAIC using mNRI methods (Citation23,Citation27). Error bars represent 95% CI. CI: confidence interval; GUS: guselkumab; IXE: ixekizumab; MAIC: matching-adjusted indirect comparison; mNRI: modified non-responder imputation; PASI: Psoriasis Area and Severity Index.
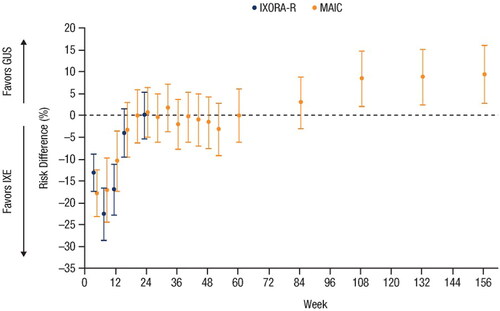
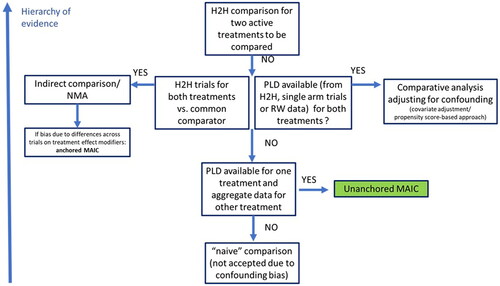
Figure 5. Schematic representation of appropriate circumstances for use of unanchored MAIC and other indirect comparison methods. H2H: head-to-head; MAIC: matching-adjusted indirect comparison; NMA: network meta-analysis; PLD: patient-level data; RW: real-world.
Supplemental Material
Download JPEG Image (35.2 KB)
Data availability statement
Data available on request from the authors; The data that support the findings of this study are available from the corresponding author, FH, upon reasonable request.