
Figures & data
Figure 1. Immunohistochemical staining for (A) mast cell tryptase and (B) IgE on skin sections from the forearm sun-exposed skin. Note that there are several IgE+ cells with cell membrane-like circular staining (B). The micrographs were taken using a 40× objective.
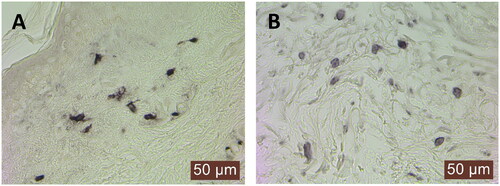
Table 1. The numbers of tryptase+ and IgE+ cells in the photodamaged forearm and sun-protected upper arm skin.
Table 2. Spearman correlation between the forearm/upper arm ratio of tryptase+ and IgE+ cells and different variables.
Table 3. The logistic regression analysis and consequent odds ratios for subjects with a photodamage score 2–4 (N = 208) compared to control subjects with a score 0–1 (N = 176) in the forearm skin in all subjects.
Table 4. Comparison of tryptase+ and IgE+ cells between atopic and non-atopic subjects.
Supplemental Material
Download Zip (71.5 KB)Data availability statement
The research data is available from the corresponding author upon separate request.