
Figures & data
Figure 1. Overall situation. (A) Annual number of published articles; (B) Top five countries/regions with the highest number of publications; (C) Cluster analysis of inter-country cooperation relationships; (D) Chord diagrams of inter-State cooperation relations.
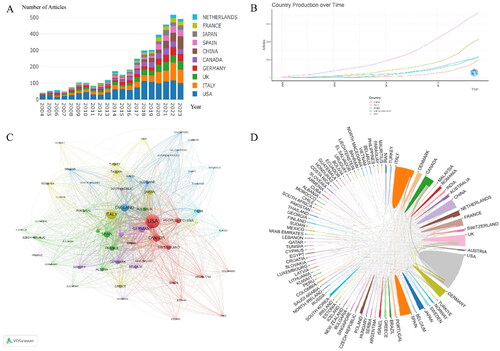
Figure 2. Analysis of author, institution, and journal. (A) Cluster diagram of inter-author collaborations; (B) Cluster diagram of inter-agency co-operation; (C) Annual publications in the top 5 journals in terms of number of publications; (D) Dual-image overlay of biologics-related journals in psoriasis.
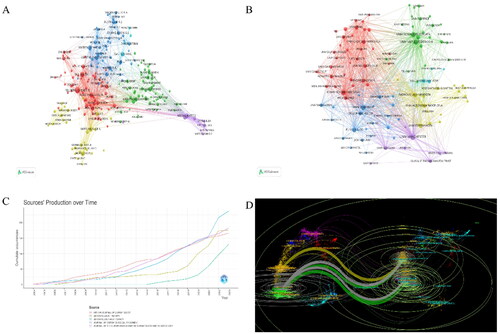
Table 1. The top ten authors by number of publications.
Figure 3. Analysis of reference. (A) Cluster analysis diagram for references; (B) Reference timeline chart; (C) Outbreak of cited references.
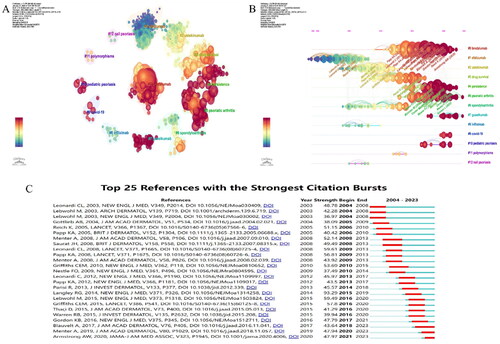
Table 2. The top five references with cited frequency.
Table 3. The top five references with the centrality.
Figure 4. Analysis of research hotspots. (A) Keyword co-occurrence chart; (B) Chart of temporal trends in research topics; (C) Keyword cluster analysis chart; (D) Keyword timeline chart.
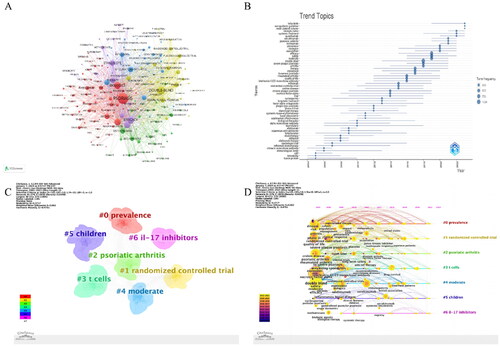
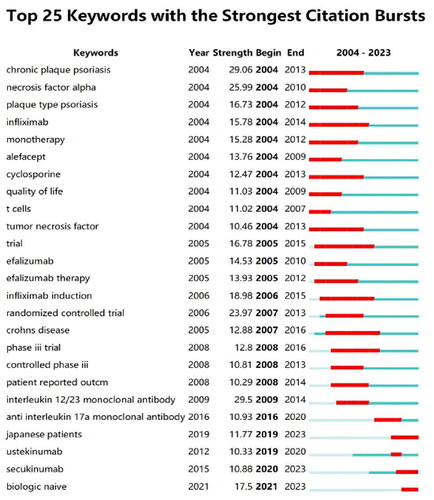
Figure 5. Outbreak of keywords.
Supplemental Material
Download ()Data availability statement
All the results found during this study are available in this article.