Figures & data
Table 1. Clinico-pathologic features at baselines.
Figure 1. (a-c) Box-plot graphs showing mean EASI (a), PP-NRS (b) and DLQI (c) scores at T0 and after 16 weeks of treatment with tralokinumab. In particular, mean EASI score (a) decresead from a 17.3 score at baseline at a score of 3 at week16; PP-NRS mean score (b) decreased from 8 to 1 after 16 weeks of tralokinumab therapy; mean DLQI (c) showed a reduction from a baseline value of 16 to a week16 value of 1; The statistical significance was assessed through Mann-Whitney U-test and was reached for EASI (p < 0.001), PP-NRS (p < 0.0001) and DLQI (p < 0.0001).
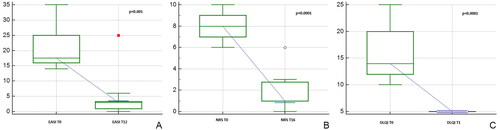
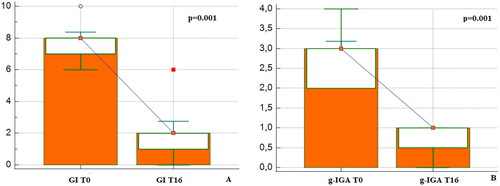
Figure 2. (a, b): Box-plot graphs showing the improvement on GI and g-IGA after 16 weeks of tralokinumab treatment. In particular, GI mean score (a) showed a reduction from 8 at baseline to 1 at week 16 while mean g-IGA (b) decreased from 3 to 1 at week 16.