
Figures & data
Figure 1. Flow chart of the study.
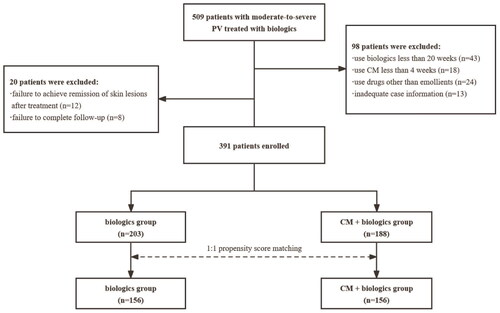
Table 1. Characteristics of patients in the combination and biologics group before and after PSM.
Figure 2. Cumulative relapse risk curves for the biologics and combination groups before (A) and after (B) PSM.
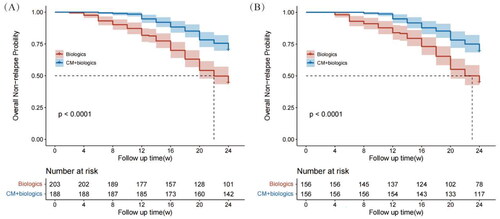
Figure 3. Forest map by multivariate Cox regression after PSM.
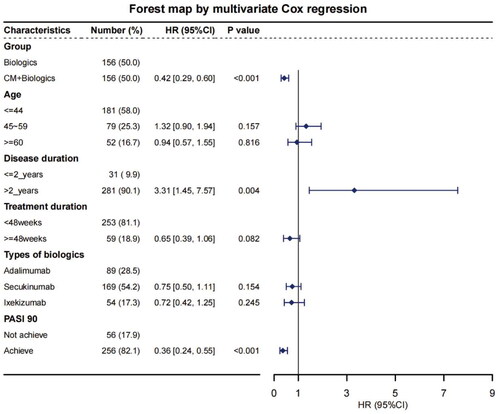
Table 2. Univariate and multivariate cox regression analyses of relapse before PSM.
Figure 4. Forest map by multivariate Cox regression in subgroup analysis.
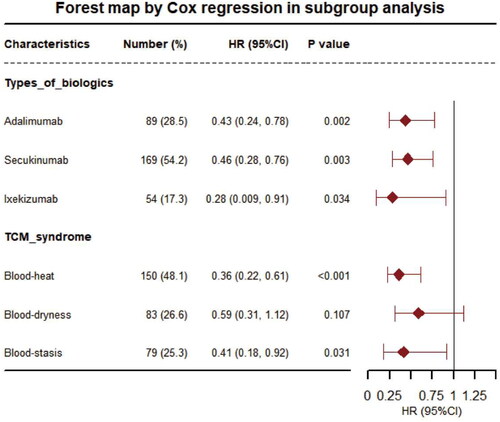
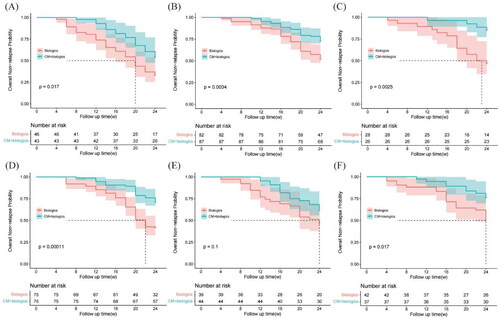
Figure 5. Cumulative relapse risk curves in subgroup analysis. (A) Adalimumab; (B) Secukinumab; (c) Ixekizumab; (d) blood-heat; (e) blood-dryness; (f) blood-stasis.
Supplemental material