
Figures & data
Figure 1. Preferred reporting items for systematic reviews and meta-analysis (PRISMA) flowchart.
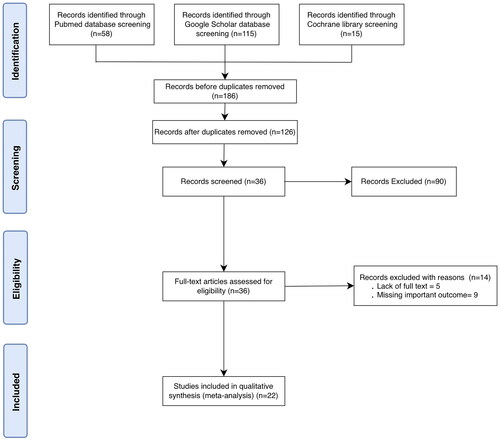
Table 1. Characteristics of the included studies.
Figure 2. Forest plot showing comparison of MASI score change between post-treatment and pretreatment using tranexamic acid alone.
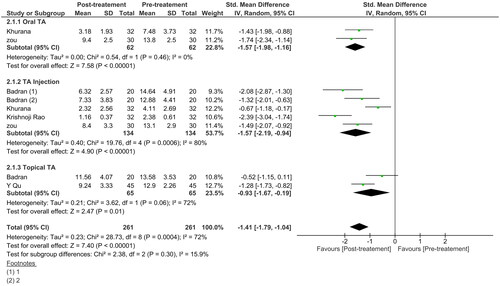
Figure 3. Forest plot showing the comparison of MASI score change between TA treatment and routine treatment alone.
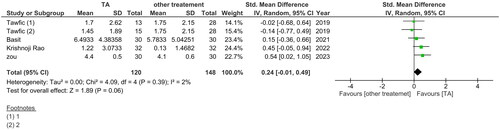
Figure 4. Forest plot showing comparison of MASI score change between post-treatment and pretreatment using tranexamic acid as adjuvant.
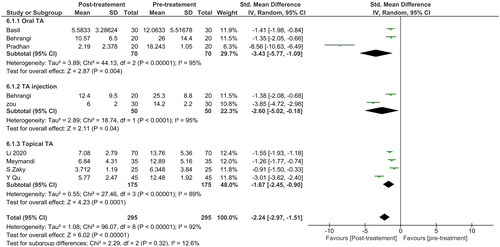
Figure 5. Forest plot showing comparison of mMASI score change between post-treatment and pretreatment using tranexamic acid alone.
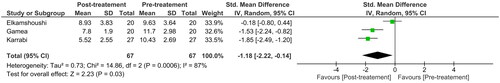
Figure 6. Forest plot showing comparison of mMASI score change between post-treatment and pretreatment using tranexamic acid as adjuvant.
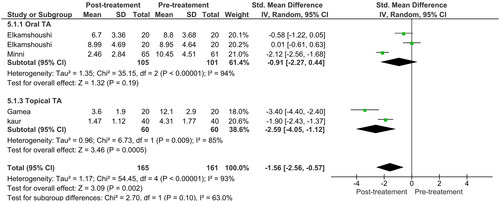
Figure 7. Forest plot showing the comparison of mMASI score change between TA treatment and routine treatment alone.
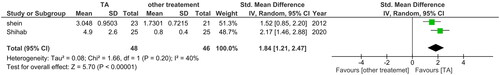
Figure 8. Forest plot showing comparison of MI score change between post-treatment and pretreatment using tranexamic acid as adjuvant.
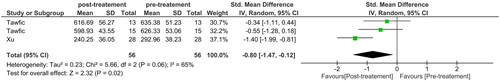
Figure 9. Forest plot showing the comparison of hemi-MASI score reduction between post- and pre- tranexamic acid treatment.
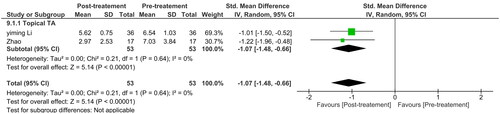
Table 2. Risk of bias.