
Figures & data
Figure 1. Patients’ selection flowchart.
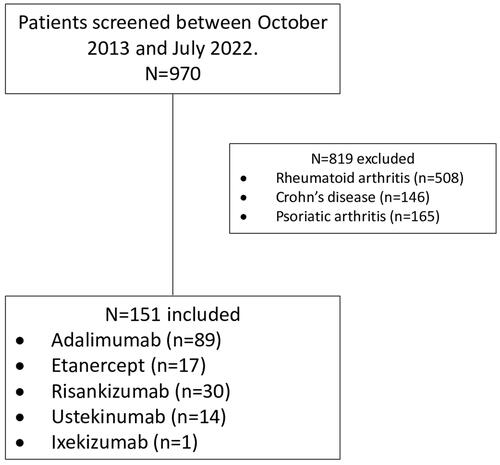
Table 1. Baseline characteristics.
Figure 2. Kaplan–Meier curve of persistence probabilities. Strata was the biological treatment. The event was discontinuation or switching the biological agent. Patients at risk in each group were presented for each biological therapy events were reported between brackets. Tick marks on the curves are indicative of censoring data (loss of follow-up).
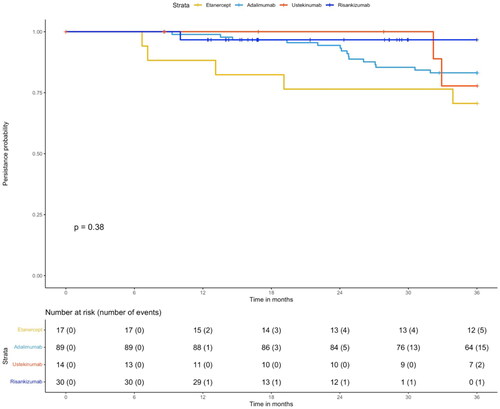
Table 2. Probability of persistence.
Figure 3. (A) Initiation, discontinuation, or switching patterns are shown for each year. Each initiation, discontinuation, or switching case was drawn in the graph for a specific year. The size of the dot represents the counts. Red is for discontinuation/switching, and blue is for initiation. (B) A tornado graph for each year for initiation (right side) and discontinuation or switching (left side) counts.
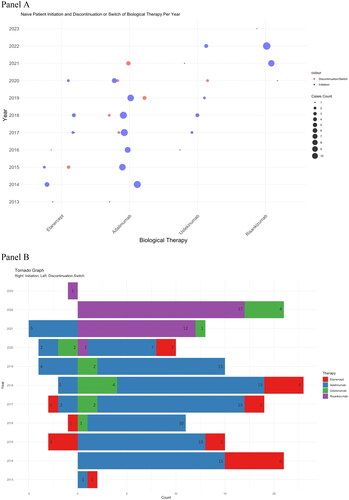
Figure 4. Switching between biological therapies patterns. Left: from, Right: to. Number of switches was shown in the graph. The width of the square is proportional to the number of patients using the agent. Note: 1 patient in the adalimumab group discontinued without switching to another agent.
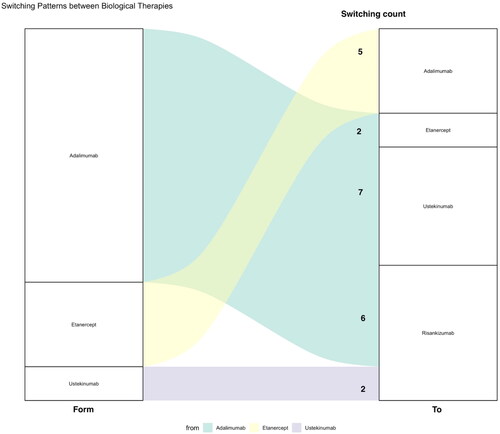
Table 3. Reasons for discontinuation or switching.