Figures & data
Table 1. The proportion of articles on different highbrow arts according to year (percentages).
Table 2. The proportion of articles on “live” and “recording” formats of the cultural products discussed according to year (percentages).
Table 3. Articles on highbrow arts according to year, the format of the cultural product discussed in the articles, and their interaction effect. Odds ratios (with 95% confidence intervals in brackets) and Wald statistics from logistic regression analysis.
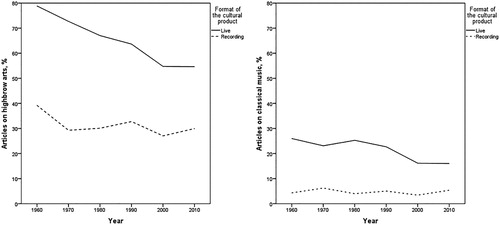
Figure 1. The proportion of articles on all highbrow arts (left) and classical music (right) according to year and the format of the cultural product discussed in the articles (percentages).