Figures & data
Table 1. Descriptive statistics.
Table 2. IDE quality indicators and associated dimensions from the literature.
Figure 1. Mean and standard deviation for quality indicators.
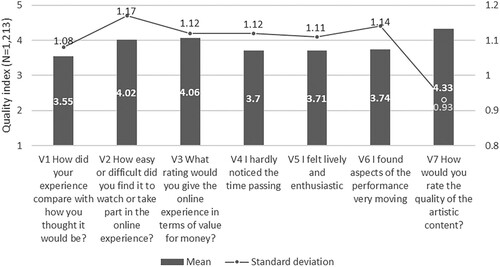
Figure 2. Mean quality index by demographics including 95% confidence interval for the mean. One-way ANOVA comparison is statistically significant for age (F-test = 5.741, p-value = 0.000).
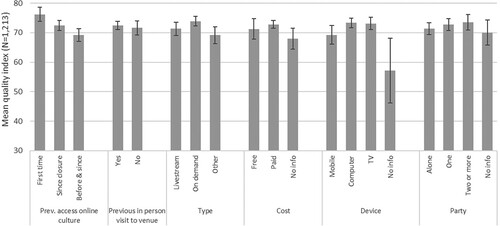
Figure 3. Mean quality index by characteristics of previous and current online experience including 95% confidence interval for the mean. One-way ANOVA comparison is statistically significant for previous online attendance (F-test = 3890.672, p-value = 0.000), type of experience and (F-test = 2043.312, p-value = 0.011) device use (F-test = 7.155, p-value = 0.000).
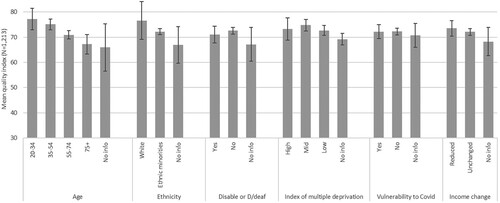
Figure 4. Mean quality indicator by Previous engagement with online culture. One-way ANOVA comparison is statistically significant for V1 (F-test = 13.623, p-value = 0.000), V2 (F-test = 4.552, p-value = 0.011), V4 (F-test = 17.751, p-value = 0.001), V5 (F-test = 4.469, p-value = 0.012) and V7 (F-test = 8.753, p-value = 0.011).
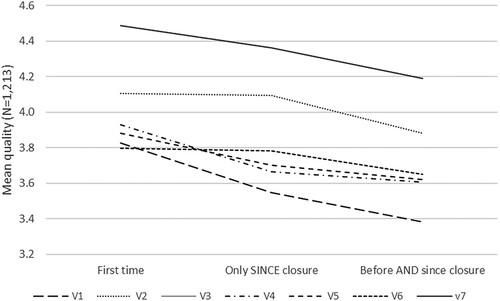
Figure 5. Mean quality index by future intentions for in-person and online participation including 95% confidence interval for the mean. One-way ANOVA comparison is statistically significant for future in-person attendance (F-test = 11855.351, p-value = 0.000), and future online participation (F-test = 60.001, p-value = 0.000).
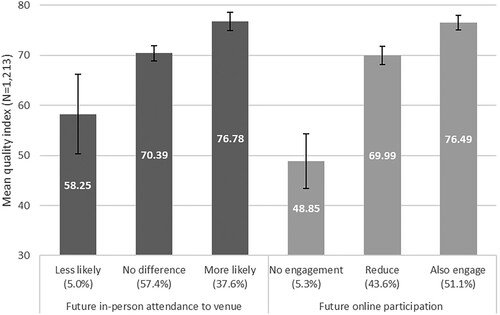
Figure 6. Distribution of future in-person attendance by terminal nodes.
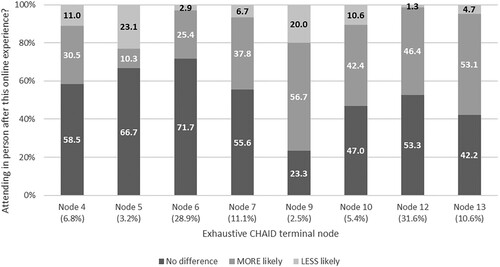
Figure 7. Distribution of future in-person attendance by terminal nodes.
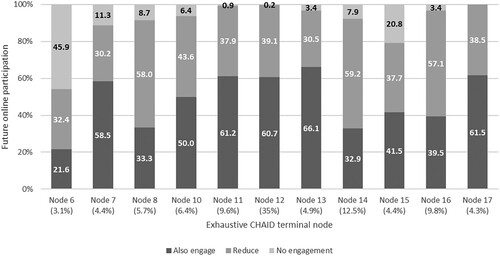
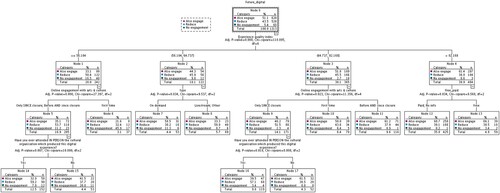
Figure A1. Exhaustive CHAID tree for future in person attendance to cultural organisation.
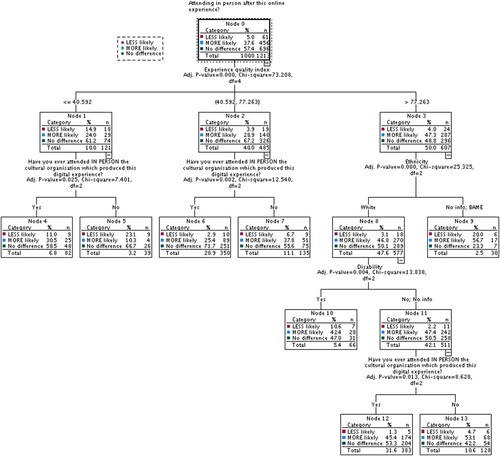
Figure A2. Exhaustive CHAID tree for future online participation in arts and culture.