
Figures & data
Table 1. Descriptive statistics of locational values of creative workers.
Figure 1. Urban (densely populated) and non-urban (intermediate and thinly populated) areas in the Degree of urbanisation of Europe and Slovenia (DEGURBA). Sources: EFGS, JRC, Eurostat, LandScan, REGIO-GIS.
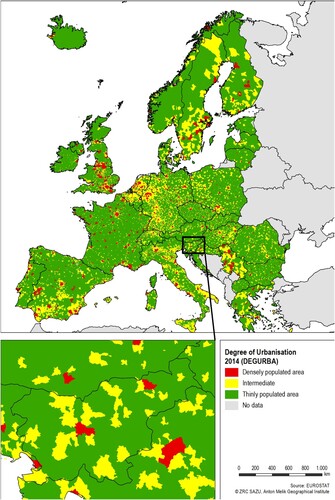
Table 2. The association analysis results (χ2 test and post-hoc test) between indicators of locational values and the degree of urbanisation (DEGURBA).
Table 3. Binomial logistic regression results (dependent variable is the level of urbanisation); 0 = rural (intermediate and thinly populated areas, 1 = urban (densely populated areas)).
Supplemental material