Figures & data
Table 1. Distribution of dicentric chromosomes (dic) in a web-based gallery of images and the resulting doses using a pooled curve (m: means, w: weighted means).
Figure 1. The digital images were provided on the RENEB website in the form of a browser based web application for examining microscopy images with two magnification steps (here: the thumbnails).
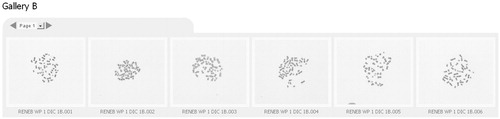
Figure 2. The observed dicentric frequency of each laboratory of Gallery A and B is provided ± SE (error bar) and the corresponding robust average (solid line) ± 1.96 SR (dotted lines)
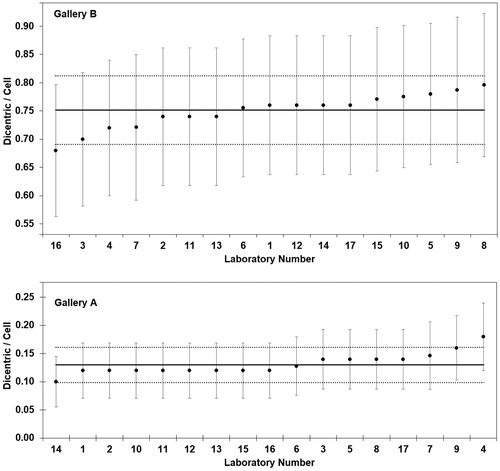
Figure 3. The gamma dose effect curves of the participating laboratories are based on the frequency of dicentric chromosomes (dic; solid line) or are based on dicentric chromosomes and centric rings (dic & cR; broken line). The weighted mean curves of dicentrics (bold solid line), dicentrics and centric rings (bold broken line) and of the MULTIBIODOSE project (bold dotted line) lie approximately in the center of the curves. The steepest (lab 2) and the flattest curve (lab 9) include dic & cR.
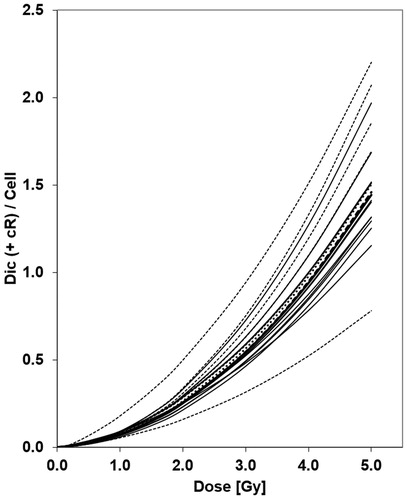
Table 2. Parameters of the gamma dose effect curves of the participating laboratories and the resulting weighted mean curves.
Figure 4. The estimated dose of each laboratory for Gallery A and B is provided together with the 95% confidence interval (error bar) and the corresponding robust average (solid line) ± 1.96 SR (dotted lines)
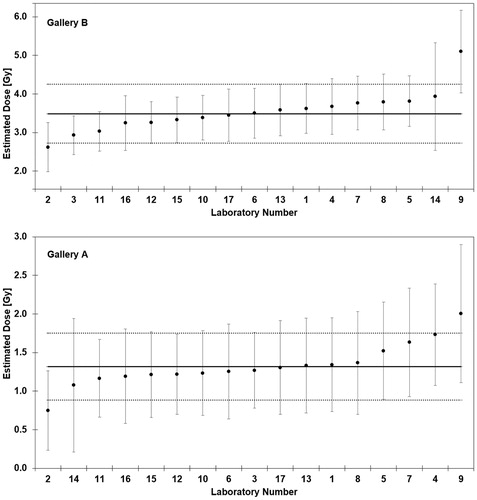
Table 3. Dose estimations with lower (LCI) and upper (UCI) 95% confidence intervals and the resulting z-score values for moderate and high dose images.
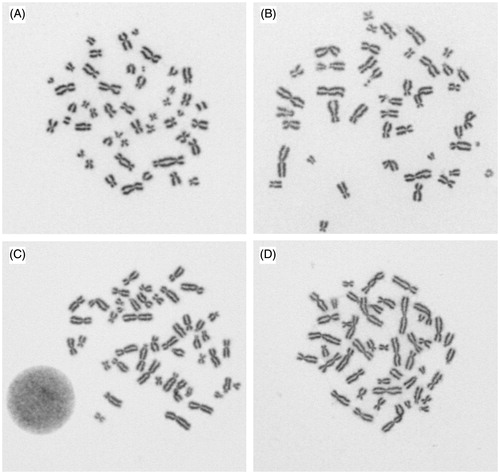
Figure 5. Four digital images from Gallery B evaluated by 17 laboratories, A: 17 x two dicentrics, B: 3 x rejected, 8 x no dicentric, 6 x one dicentric, C: 6 x no dicentric, 11 x one dicentric, D: 1 x rejected, 12 x one dicentric, 4 x two dicentrics