Figures & data
Figure 1. Average monthly number of institutions participating in the weekly RENEB accident simulation exercise. The error bars represent standard deviations counted for each month with the exception of December, when the exercise was performed only during the first week. Dashed horizontal line shows the total number of participating laboratories.
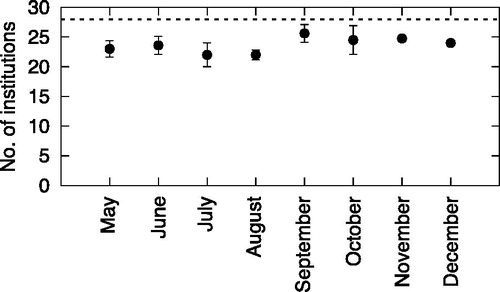
Table 1. An example of patient codes sent to a SL. Category refers to the following triage category: GREEN: <1 Gy, ORANGE: 1-2 Gy, RED: >2 Gy.
Table 2. The various exposure scenarios that had to be ascribed to each dosimetric data set shown in Table 1.
Figure 2. The scheme of a simulation exercise describing the role of SL and RL.
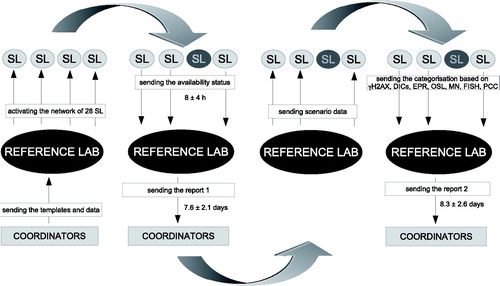
Figure 3. Mean response time in hours for each SL. Error bars represent standard deviations.
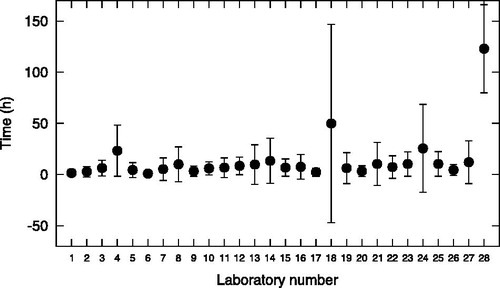
Figure 4. The time of sending reports 1 and 2 by each RL. The dashed line represents the mean time of receiving report 1; the solid line – of report 2.
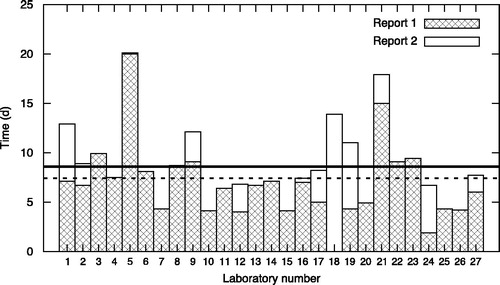
Table 3. Information about the declared average capacity of the SL to analyse samples by each assay. SD stands for standard deviation.
Figure 5. Distribution of RENEB assays in the declared capacity to perform triage. Information about manual and automated analyses was pooled.
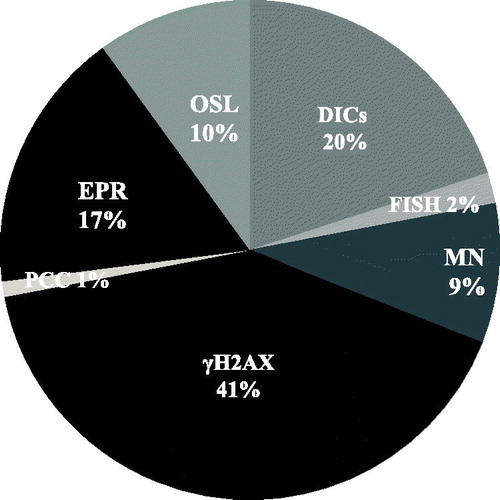
Figure 6. The accuracy of category estimation for all SLs compared with one selected institute. The data points with different shapes represent four different sets of patient codes. Error bars represent standard deviations.
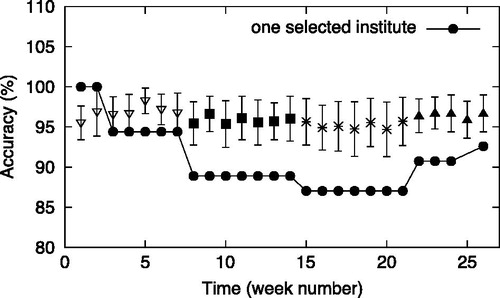
Table 4. SL procedures for the triage estimation.
Figure 7. Mean accuracy of each scenario assessment (green, orange and red). Error bars represent standard deviations.
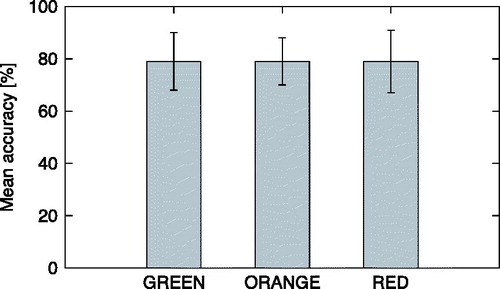
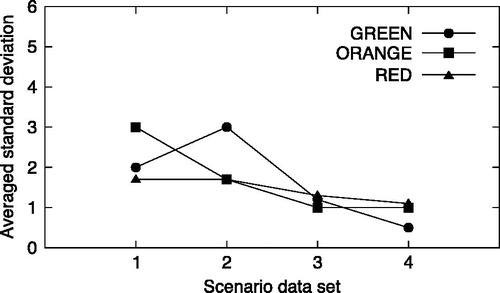
Figure 8. Standard deviations of the scenario categorization for green, orange and red categories. All four sets of scenario data were considered.