Figures & data
Table 1. Variations in the standard protocols of the CBMN assay between the participating labs in intercomparison 1 and 2.
Figure 1. Micronucleus calibration curves of the RENEB participating labs (L). Calibration curves are shown for automated (black lines), semi-automated (green lines) and manual (blue/purple lines) scoring methods. Labs 1, 2, 4, 5, 12 provided calibration curves for automated and semi-automated scoring. Labs 3, 6–11 provided calibration curves for manual micronucleus scoring. One calibration curve (L8) was set up for 200 kV X-rays, nine calibration curves were set up for Co-60 gamma-rays and two calibration curves (L1, L9) were set up for Cs-137 gamma-rays.
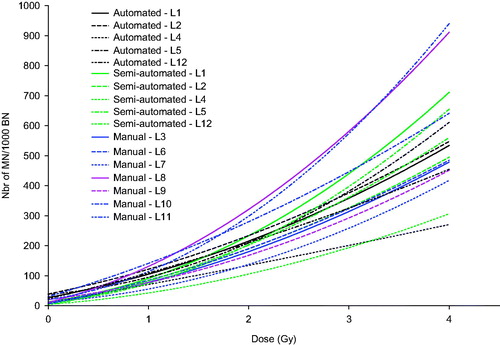
Table 2. Radiation characteristics and coefficients of the MN dose response curves of the RENEB labs.
Table 3(a). Number of scored binucleate (BN) cells and observed micronucleus frequencies (micronuclei (MN)/1000 BN cells), stratified by scoring procedure for all labs participating in the first intercomparison. Mean MN frequencies ± SEM per scoring procedure are also presented.
Table 3(b). Number of scored binucleate (BN) cells and observed micronucleus frequencies (micronuclei (MN)/1000 BN cells), stratified by scoring procedure for all labs participating in the second intercomparison. Mean MN frequencies ± SEM per scoring procedure are also presented.
Table 4(a). Individual dose estimates reported by the laboratories participating in the first intercomparison exercise (laboratories: L1–L12), stratified by scoring procedure. Mean dose estimates ± SEM per scoring procedure are also presented.
Table 4(b). Individual dose estimates reported by the laboratories participating in the second intercomparison exercise (laboratories: L1–L16), stratified by scoring procedure. Mean dose estimates ± SEM per scoring procedure are also presented.
Figure 2. Variance/mean (σ2/μ) values, representing the overdispersion of the MN frequency distribution with respect to the Poisson distribution, are shown for the sham-irradiated control (0 Gy), the total body simulated (0.94 Gy, 3.27 Gy) and partial body (PB) simulated (4.75 Gy) exposures of the first intercomparison. Per dose point, the σ2/μ values are grouped per scoring method: automated scoring (black symbols), semi-automated scoring (green symbols), manual scoring (blue symbols). Values of σ2/μ ≥ 1.5 (dotted line) were taken as being indicative for partial body exposure.
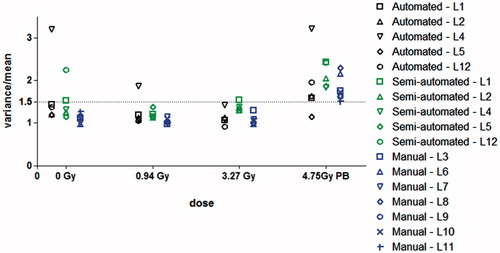
Figure 3. z-scores obtained in the first (a) and second (b) intercomparison exercise for the comparison of individual labs’ dose estimates with the true dose. The z-scores of all the participating labs are given for the different dose points and scoring methods [automated (black symbols), semi-automated (green symbols) or manual (blue symbols)]. Dose estimates are classified as satisfactory (| z | ≤ 2), questionable (2 < | z | < 3), and unsatisfactory (| z | ≥ 3).
![Figure 3. z-scores obtained in the first (a) and second (b) intercomparison exercise for the comparison of individual labs’ dose estimates with the true dose. The z-scores of all the participating labs are given for the different dose points and scoring methods [automated (black symbols), semi-automated (green symbols) or manual (blue symbols)]. Dose estimates are classified as satisfactory (| z | ≤ 2), questionable (2 < | z | < 3), and unsatisfactory (| z | ≥ 3).](/cms/asset/82b41ab5-4842-428c-9ec8-5b57a3660e4f/irab_a_1206231_f0003_c.jpg)
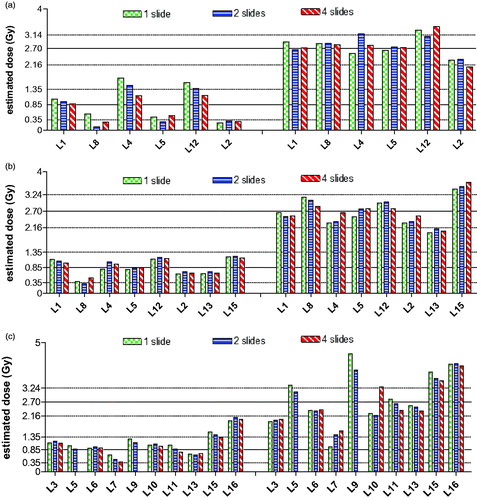
Figure 4. Comparison of the dose estimates obtained by scoring 1, 2 or 4 slides in automated (a), semi-automated (b) or manual mode (c). Dose estimations for the 0.85 Gy and the 2.70 Gy dose points are given for each lab. The dotted lines represent the uncertainty intervals.