Figures & data
Table 1. General characteristics of technical procedures utilized and experiences of the contributing institutions.
Table 2. Methods used by contributing labs.
Table 3. pH levels in whole blood from three donors at varying time-points and conditions.
Figure 1. Different shipment conditions of whole blood with RNALater. (A) Whole blood with RNALater after centrifugation for 1 min without shipment. (B) Whole blood with RNALater after centrifugation for 1 min after shipment on wet ice. (C) Centrifugation results of whole blood with RNALater samples from three donors at varying storage conditions.
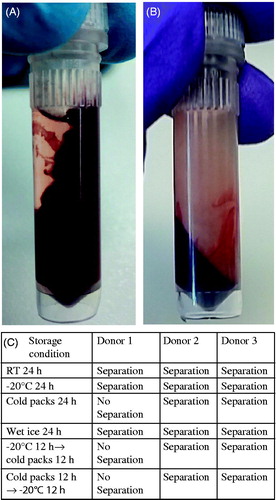
Table 4. Laboratory intercomparison of RNA quality and quantity.
Figure 2. Calibration curves from the QRT-PCR labs for diluted blood (left panels) and whole blood (right panels) from Lab 1 (A, B), Lab 2 (C, D), Lab 4 (E, F) and Lab 5 (G). For Lab 5 whole blood and diluted blood calibration curves are both displayed in panel E. Error bars reflect the SEM with n = 3 (Lab 2), n = 12/17 (Lab 4), n = 8 (Lab 5), but for Lab 1 error bars represent min/max CT-values, because measurements were done in duplicate.
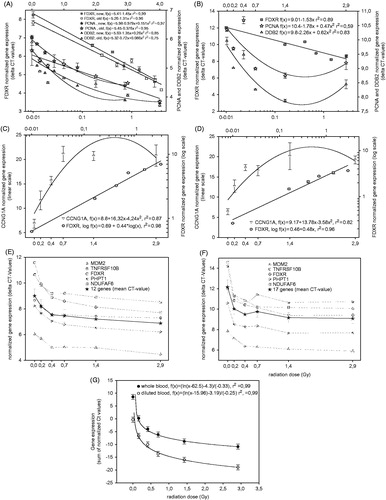
Figure 3. Normalized expression values of FDXR (A, log fit) and CCNG1 (B, linear-quadratic fit) from calibration (0, 0.16, 0.41, 0.70, 1.43 and 2.92 Gy) and blind (0, 0.44, 1.08 and 1.89 Gy) samples. Irradiation occurred either in diluted blood (filled in shapes) or whole blood (not filled in shapes) samples.
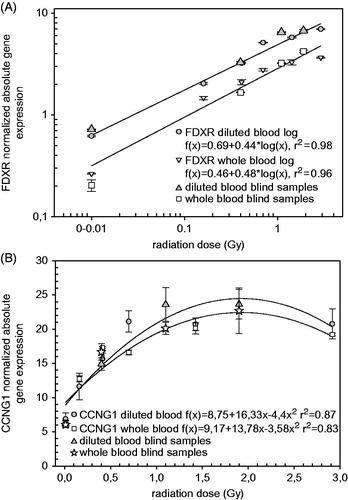
Table 5. Reported dose estimates from labs running QRT-PCR or microarrays for each of the samples irradiated with a known (true) dose.
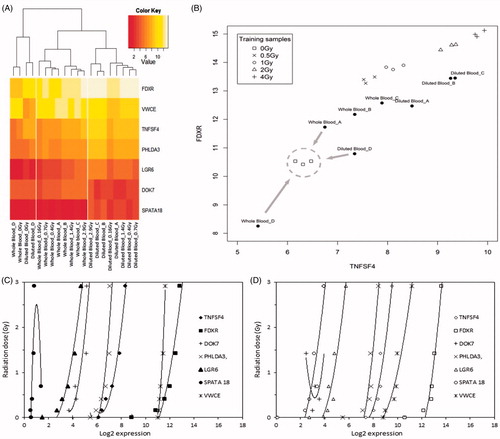
Figure 4. Microarray dose estimation approach. (A) K nearest neighbour classification based on the two radiation responsive genes FDXR and TNFSF4. For each test sample (whole blood sample A–D and diluted blood sample A–D) the three nearest training samples with known radiation doses (0–4 Gy) were determined. Afterwards, the test sample was assigned to the most frequent radiation dose among its three nearest neighbours. The training samples were derived from ex-situ irradiated blood from six non-related healthy donors (three males and three females of three age classes; Boldt et al. Citation2012). Gene expression of FDXR and TNFSF4 are given as Log2 values. (B) Hierarchical clustering of calibration samples and test samples. The heat-map illustrates the radiation-induced expression changes of the seven signature genes of Lab 3 (Boldt et al. Citation2012). The hierarchical clustering of the samples (columns) reveals that non-irradiated samples can be easily discriminated from irradiated samples (0.16–2.92 Gy). Also, all irradiated whole blood samples as well as all irradiated diluted blood samples form a separate cluster, indicating that sample treatment influences significantly the gene expression response of the signature genes in the irradiated samples. Log2 gene expression values obtained by DNA microarray analysis are colored from red (low) to white (high). (C, D) Regression curves of the signature genes used for dose assessment in Lab 3. C – whole blood samples; D – diluted blood samples. Gene expression is given as Log2 value.