Figures & data
Table 1. Calibration curve coefficients and covariances, calculated using R (Citation2014), for the four biodosimetry assays.
Table 2. Non-parametric bootstrap simulation of dicentric assay results to assess the magnitude of the confidence limits actually covered for a desired confidence level of 95%. The most accurate confidence (credible) region values for each experiment, those closer to 95%, are given in bold.
Figure 1. Comparison of standard deviations based on simulated chromosome aberration data for doses of 0, 0.5, 1, 1.5, 2 and 2.5 Gy using the MBD method for the four assays: bold dotted line – DIC; solid line – MN; bold dashed line – gamma-H2AX; bold solid line – PCC.
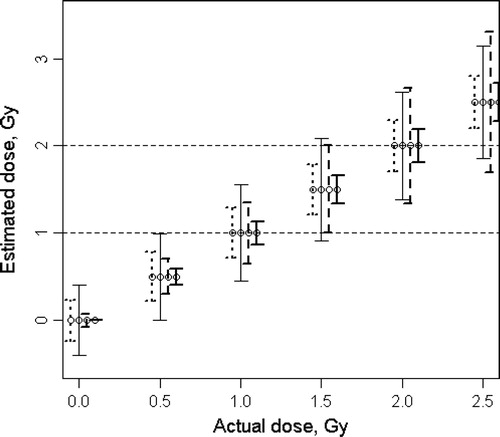
Figure 2. Example normalized posterior dose distribution (‘calibrative density’) for a simulated HDR exposure resulting in a yield of 0.17 dicentrics per cell to give a nominal dose of 1.5 Gy. The expected dose is 1.53 ± 0.28. The probability of being in between 1 and 2 Gy (shaded in grey) is calculated as 0.917.
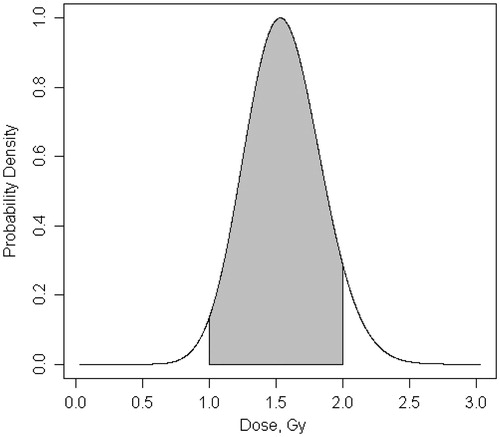
Table 3. Cumulative normal (ISO, IAEA, Merkle and MBD) or Bayesian posterior probabilities of being in correct triage category, given calculated uncertainties, for simulated doses of 0, 0.5, 1, 1.5, 2 and 2.5 Gy.
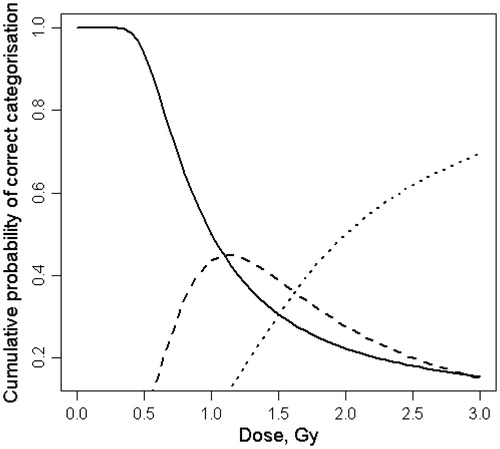
Figure 3. Cumulative probability of correct categorization – probability that a dose is placed in the category 0–1 Gy (solid line), 1–2 Gy (dashed line) or 2+ Gy (dotted line).