
Figures & data
Table 1. Details of irradiation of blood samples for 1st and 2nd exercise and donor information are given.
Figure 1. Dose effect curves of the participating laboratories used for dose assessment based on dicentrics, dicentrics and rings or no information was given in the scoring sheet. RENEB partner laboratories (L), RENEB candidates (C) and non-EU organizations (N).
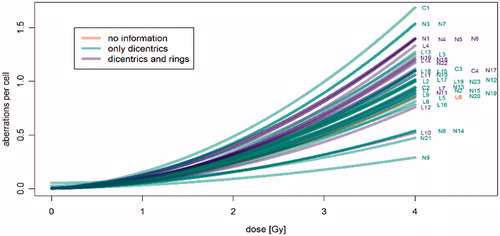
Figure 2. 2nd intercomparison – 0.85 Gy (Re 5) – top: Number of dicentrics in 50 cells scored for both slides of all participating laboratories, RENEB partners (L1–L19), the RENEB candidates (C1–C4) and non-EU partners (N1–N23) (dots), the theoretical expectation range (shaded area) referring to the mean number of dicentrics of all laboratories (5.13 dics/50cells; dashed line) and the assumption that dicentrics are Poisson distributed. bottom: Estimated doses and 95% confidence intervals for all slides, physical dose (solid line), average dose (not solid line) and tolerance region (0.85 ± 0.5 Gy, shaded area).
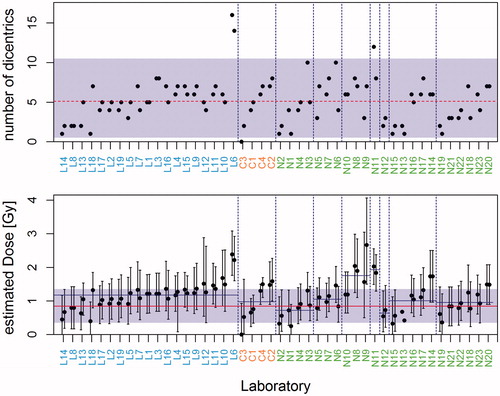
Figure 3. 2nd intercomparison – 2.7 Gy (Re 6) – top: Number of dicentrics in 50 cells scored for both slides of all participating laboratories, RENEB partners (L1–L19), the RENEB candidates (C1–C4) and non EU partners (N1–N23), (dots); the theoretical expectation range (shaded area) referring to the mean number of dicentrics of all laboratories (28.8 dics/50 cells; dashed line) and the assumption that dicentrics are Poisson distributed. bottom: Estimated doses and 95% confidence intervals for all slides, the physical dose (solid line), the mean dose (not solid line) and the tolerance region (2.7 Gy ±20%, shaded area).
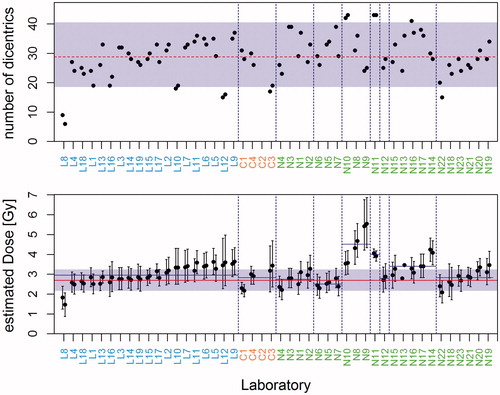
Figure 4. The z-scores for all estimated doses based on 50 cells/slide for all participating labs, RENEB partners (L1–L19), the RENEB candidates (C1–C4) and non-EU partners (N1–N23). ![]()
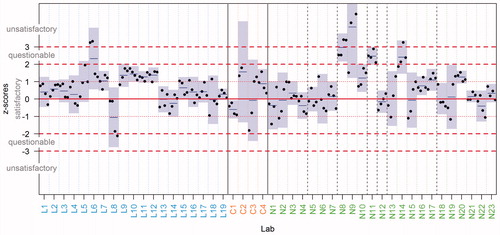
Table 2. Classification of dose estimations performed in the frame of the 2nd intercomparison reported by the RENEB partners, RENEB candidates and non-EU laboratories for low dose (0.85 Gy) and high dose (2.7 Gy) for 20, 30 and 50 cells scored.